Intel closes 23% higher after Nvidia takes $5B stake
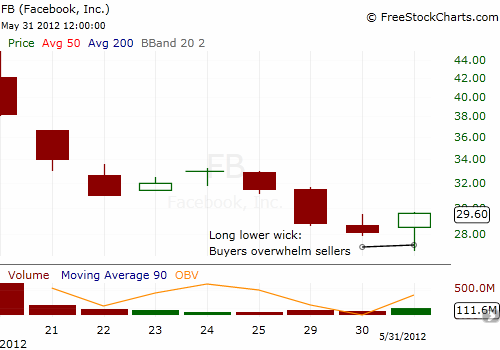
For only the second time in its nine days as a publicly traded company, Facebook (FB) closed at a higher price than the high of the previous day. Sure, it is only a few pennies. But for a stock getting sold nearly non-stop since its IPO, this counts as progress. More importantly, FB printed a reversal pattern in the form of a hammer candlestick. The long wick shown below is where buyers finally stepped in to pick the meat off the bones sellers left behind. The increase in volume further supports this trading action as a potential reversal.
I will not be surprised if today’s low proves to be a sustained bottom. Market makers rolled out options on Tuesday, likely hoping to recover some of the massive losses they suffered managing Facebook’s opening day. After the first day, puts were strongly favored in a 1.33 open interest put/call ratio. Interestingly, traders reached for more calls than puts the following day driving the ratio down to 1.2. Total open interest increased from 193,369 options to 282,257 (You can find options data on Facebook at Schaeffer’s Investment Research). If the result of today’s action drives the put/call ratio down even lower, I will feel slightly more confident that Facebook is about to embark on a rally. If it does, enjoy it while it lasts.
As with all hammers, the pattern is confirmed on a higher close, and it is invalidated by a close below the hammer’s low. An invalidated hammer can create a fresh shorting candidate as the violation prints a continuation of the prevailing downtrend.
(At some point soon, I will write a more complete piece on my thoughts on Facebook’s stock, and how I screwed up the bullish call on Zynga. For now, there are PLENTY of negative voices out there for you to enjoy. Contrarians, take note!).
Full disclosure: long FB, ZNGA
Which stocks should you consider in your very next trade?
The best opportunities often hide in plain sight—buried among thousands of stocks you'd never have time to research individually.
That's why smart investors use our Stock Screener with 50+ predefined screens and 160+ customizable filters to surface hidden gems instantly.
For example, the Piotroski's Picks method averages 23% annual returns by focusing on financial strength, and you can get it as a standalone screen. Momentum Masters catches stocks gaining serious traction, while Blue-Chip Bargains finds undervalued giants.
With screens for dividends, growth, value, and more, you'll discover opportunities others miss. Our current favorite screen is Under $10/share, which is great for discovering stocks trading under $10 with recent price momentum showing some very impressive returns!
