Nvidia, AMD to pay 15% of China chip sales revenue to US govt- FT
Although it's October again and some are calling for an overdue stock market correction, the S&P 500 and the Russell 2000 indices continue to exhibit well-defined uptrends. Let's check out current charts to define the bullish parameters, and to have an eye on support levels that should hold if the rally is to continue into 2014.
Large Caps
The first chart is the S&P 500 Index weekly bar. The index is trading at resistance near the upper extremities of both the major bullish trend channel (e.g. in red) and the minor bullish trend channel (e.g. in yellow). Your first inclination may be to assume a correction from these resistance areas is imminent. Let me state – this condition does not mandate a significant retreat from these levels. Could it happen? Absolutely it can. But the fact that the index has pressed this upper channel line for some time and has done so while continuing to make new highs with each retest certainly illustrates the strength of the current rally. The proper timing of any retreat might prove difficult. But whether up or down from here, the index's chart parameters remain well-defined, and since we've now clearly identified the resistance areas, let's examine support levels.
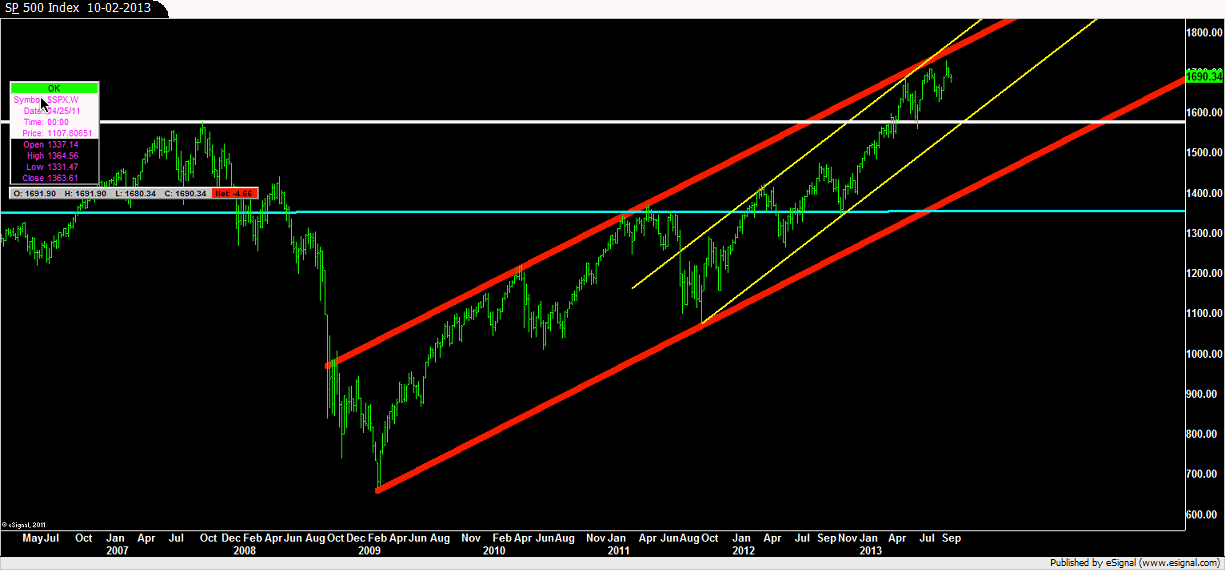
Initial support rests at the support line of the minor trend channel (approximately 1600.00 to 1625.00), and at the index's previous all-time highs in the 1575.00 area). Final major support is well beneath those levels at the major trend channel support line, which until breached confirms the S&P 500's uptrend.
Small Caps
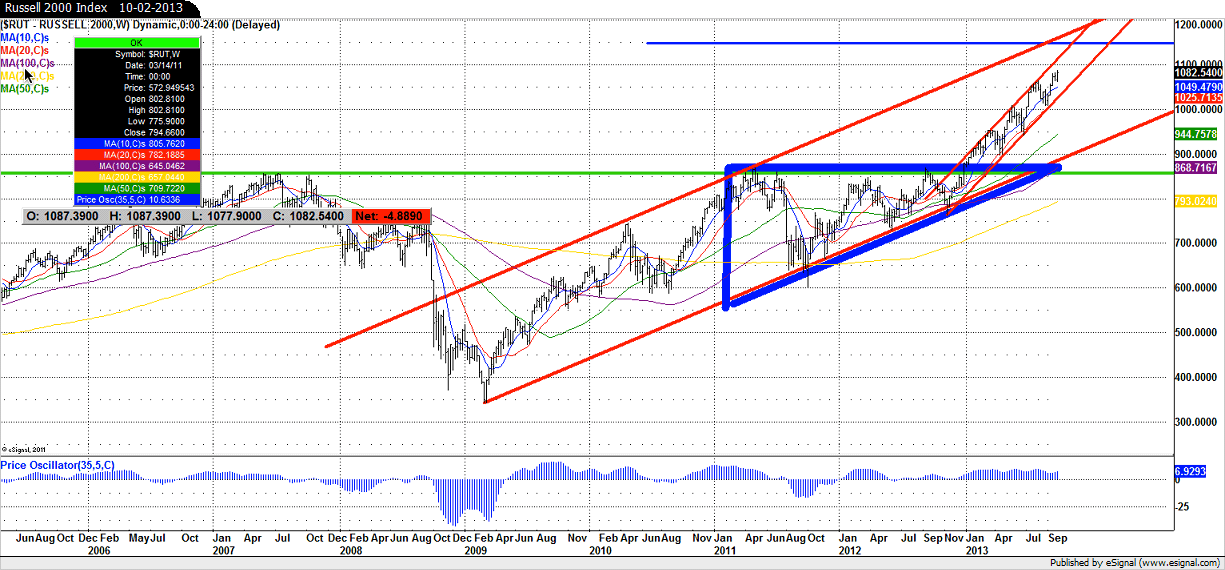
The next weekly bar chart is the Russell 2000 Index. Once again please note the major bullish trend channel that remains intact. Also note the continued development of the bullish ascending triangle that we've been monitoring for some time (e.g. in blue). Like the S&P 500, the Russell is likewise in uncharted waters. Resistance once again lays at the upper lines of the bullish trend channels; while we'll turn to moving averages to find minor support. The ten-week moving average (MA) is in the 1050.00 area. The twenty-week MA rests at 1025.00, and the 50-week MA is down at 944.00 currently. Final major support lays in wait at both the major trend channel support line, and at the index's previous all-time high in the 860.00 area, which coincides with the breakout area for the ascending triangle.
In closing, as the corn harvest gives way to pumpkin patches, and as fall's perennial period of concern for stocks is upon us, the S&P 500 Index is testing resistance levels; but make no mistake, major stock indices are solidly encased in bullish chart formations. Although I'm well aware of the numerous headwinds facing stock valuations, I'll watch the clearly defined chart parameters to decide when I believe a major stock market correction is upon us. Simply put – the trend continues to be my friend while I watch support levels as 2014 approaches.
Dominic Cimino
Chief Investment Strategist
Financial Advisor
Preferred Planning Concepts, LLC
Large Caps
The first chart is the S&P 500 Index weekly bar. The index is trading at resistance near the upper extremities of both the major bullish trend channel (e.g. in red) and the minor bullish trend channel (e.g. in yellow). Your first inclination may be to assume a correction from these resistance areas is imminent. Let me state – this condition does not mandate a significant retreat from these levels. Could it happen? Absolutely it can. But the fact that the index has pressed this upper channel line for some time and has done so while continuing to make new highs with each retest certainly illustrates the strength of the current rally. The proper timing of any retreat might prove difficult. But whether up or down from here, the index's chart parameters remain well-defined, and since we've now clearly identified the resistance areas, let's examine support levels.
Initial support rests at the support line of the minor trend channel (approximately 1600.00 to 1625.00), and at the index's previous all-time highs in the 1575.00 area). Final major support is well beneath those levels at the major trend channel support line, which until breached confirms the S&P 500's uptrend.
3rd party Ad. Not an offer or recommendation by Investing.com. See disclosure here or remove ads.
Small Caps
The next weekly bar chart is the Russell 2000 Index. Once again please note the major bullish trend channel that remains intact. Also note the continued development of the bullish ascending triangle that we've been monitoring for some time (e.g. in blue). Like the S&P 500, the Russell is likewise in uncharted waters. Resistance once again lays at the upper lines of the bullish trend channels; while we'll turn to moving averages to find minor support. The ten-week moving average (MA) is in the 1050.00 area. The twenty-week MA rests at 1025.00, and the 50-week MA is down at 944.00 currently. Final major support lays in wait at both the major trend channel support line, and at the index's previous all-time high in the 860.00 area, which coincides with the breakout area for the ascending triangle.
In closing, as the corn harvest gives way to pumpkin patches, and as fall's perennial period of concern for stocks is upon us, the S&P 500 Index is testing resistance levels; but make no mistake, major stock indices are solidly encased in bullish chart formations. Although I'm well aware of the numerous headwinds facing stock valuations, I'll watch the clearly defined chart parameters to decide when I believe a major stock market correction is upon us. Simply put – the trend continues to be my friend while I watch support levels as 2014 approaches.
Dominic Cimino
Chief Investment Strategist
Financial Advisor
3rd party Ad. Not an offer or recommendation by Investing.com. See disclosure here or remove ads.
Preferred Planning Concepts, LLC
Which stock should you buy in your very next trade?
With valuations skyrocketing in 2024, many investors are uneasy putting more money into stocks. Unsure where to invest next? Get access to our proven portfolios and discover high-potential opportunities.
In 2024 alone, ProPicks AI identified 2 stocks that surged over 150%, 4 additional stocks that leaped over 30%, and 3 more that climbed over 25%. That's an impressive track record.
With portfolios tailored for Dow stocks, S&P stocks, Tech stocks, and Mid Cap stocks, you can explore various wealth-building strategies.