
The New York Fed released its monthly manufacturing survey for December which showed a decrease in activity in the region to -8.1 from -5.22 in November. The current reading has kept the survey in negative territory for five consecutive months which is the longest streak since the debt ceiling debate raged in the summer of 2011. The only other two occasions where the index posted five, or more, consecutive months of negative readings were during the previous two recessions.
The chart of the day is the Empire State Manufacturing Composite Index which is the average of the current and future expectation surveys. While this particular survey has a very limited history the summer of 2011, which was caused by the debt ceiling debate and the economic slowdown due to the Japanese earthquake/tsunami, was a very similar decline to what is currently occurring.
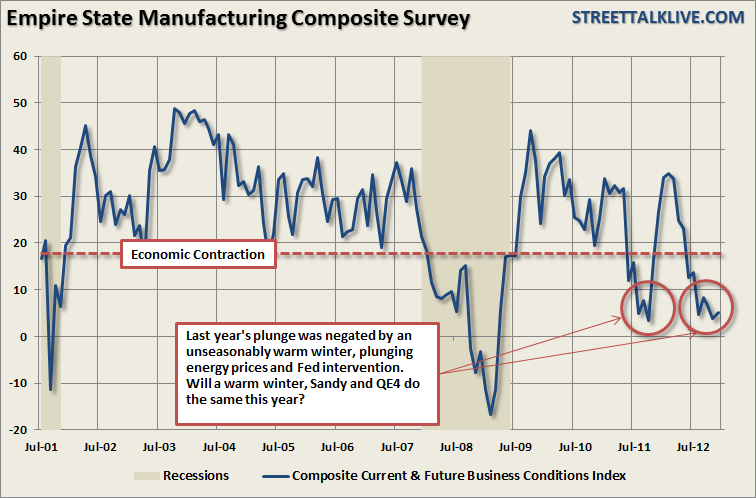
As noted in the chart above the plunge in the region's economic confidence was offset by Federal Reserve intervention, the warmest winter in 65 years and plunging oil and energy prices which provided an effective tax-credit to consumers. With the economy again under pressure as activity slows, and the New York region further impacted by Hurricane Sandy, the question is becoming whether a warm winter, a boost from Hurricane Sandy as rebuilding and restocking takes place, and the Fed's QE4 will be enough to once again boost the region back into growth territory?
The chart below shows the month over month changes in the index.
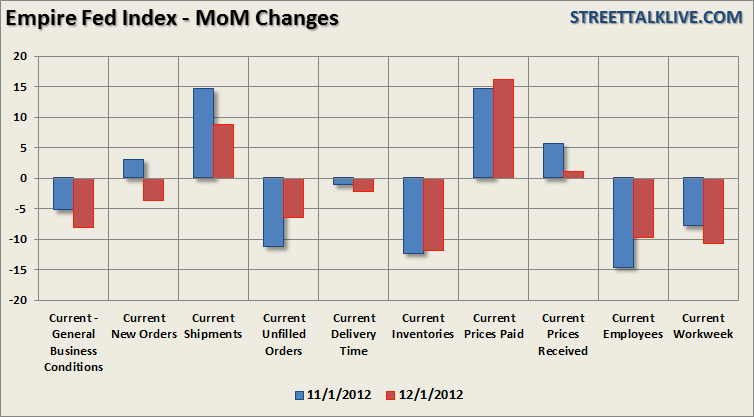
While the headline reading declined there was little positive in the internal measures. New Orders, which should have improved post Sandy, swung from to a -3.70 from 3.08 in November. Shipments also declined falling from 14.59 to 8.83 as inventories continue to be liquidated even as the rate slowed from -12.36 to -11.83. In further concern of deteriorating profit margins Prices Paid rose from 14.61 to 16.13 while Prices Received fell from 5.62 to 1.08. Employment remains in contraction, as well as the overall work week, which does not bode well for future gains.
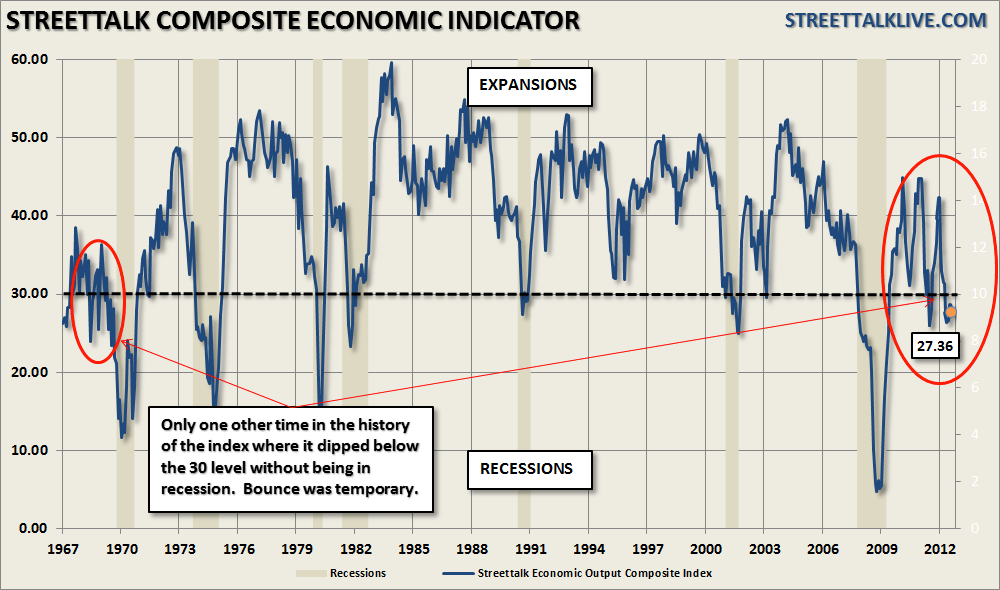
There are two caveats with this report. The first is that this particular region is still being impacted by the effects of Hurricane Sandy. However, the "Sandy Effect" does not fully explain the four previous consecutive months of decline. Secondly, this is just one region of the whole country with a fairly limited history of data. Therefore, we will need to see the December reports from the other various surveys that comprise the Composite Economic Index in the weeks ahead.
While I continue to expect that we will see a "pop" in activity post Hurricane Sandy -- I expect that this activity will be fairly short lived as the data trends in most economic reports remain very weak. Should we have another exceptionally warm winter which leads to lower utility costs, while employment and production remain at higher levels, it is is likely that the economy could perform better than the data currently suggests. However, from a fiscal policy standpoint we cannot keep relying on
The chart of the day is the Empire State Manufacturing Composite Index which is the average of the current and future expectation surveys. While this particular survey has a very limited history the summer of 2011, which was caused by the debt ceiling debate and the economic slowdown due to the Japanese earthquake/tsunami, was a very similar decline to what is currently occurring.
As noted in the chart above the plunge in the region's economic confidence was offset by Federal Reserve intervention, the warmest winter in 65 years and plunging oil and energy prices which provided an effective tax-credit to consumers. With the economy again under pressure as activity slows, and the New York region further impacted by Hurricane Sandy, the question is becoming whether a warm winter, a boost from Hurricane Sandy as rebuilding and restocking takes place, and the Fed's QE4 will be enough to once again boost the region back into growth territory?
The chart below shows the month over month changes in the index.
3rd party Ad. Not an offer or recommendation by Investing.com. See disclosure here or remove ads.
While the headline reading declined there was little positive in the internal measures. New Orders, which should have improved post Sandy, swung from to a -3.70 from 3.08 in November. Shipments also declined falling from 14.59 to 8.83 as inventories continue to be liquidated even as the rate slowed from -12.36 to -11.83. In further concern of deteriorating profit margins Prices Paid rose from 14.61 to 16.13 while Prices Received fell from 5.62 to 1.08. Employment remains in contraction, as well as the overall work week, which does not bode well for future gains.
There are two caveats with this report. The first is that this particular region is still being impacted by the effects of Hurricane Sandy. However, the "Sandy Effect" does not fully explain the four previous consecutive months of decline. Secondly, this is just one region of the whole country with a fairly limited history of data. Therefore, we will need to see the December reports from the other various surveys that comprise the Composite Economic Index in the weeks ahead.
While I continue to expect that we will see a "pop" in activity post Hurricane Sandy -- I expect that this activity will be fairly short lived as the data trends in most economic reports remain very weak. Should we have another exceptionally warm winter which leads to lower utility costs, while employment and production remain at higher levels, it is is likely that the economy could perform better than the data currently suggests. However, from a fiscal policy standpoint we cannot keep relying on
3rd party Ad. Not an offer or recommendation by Investing.com. See disclosure here or remove ads.
"Mother Nature" to keep bailing out the economy. Eventually, real policy changes will need to made in order to promote longer term economic growth.Which stock should you buy in your very next trade?
AI computing powers are changing the stock market. Investing.com's ProPicks AI includes 6 winning stock portfolios chosen by our advanced AI. In 2024 alone, ProPicks AI identified 2 stocks that surged over 150%, 4 additional stocks that leaped over 30%, and 3 more that climbed over 25%. Which stock will be the next to soar?
Unlock ProPicks AI