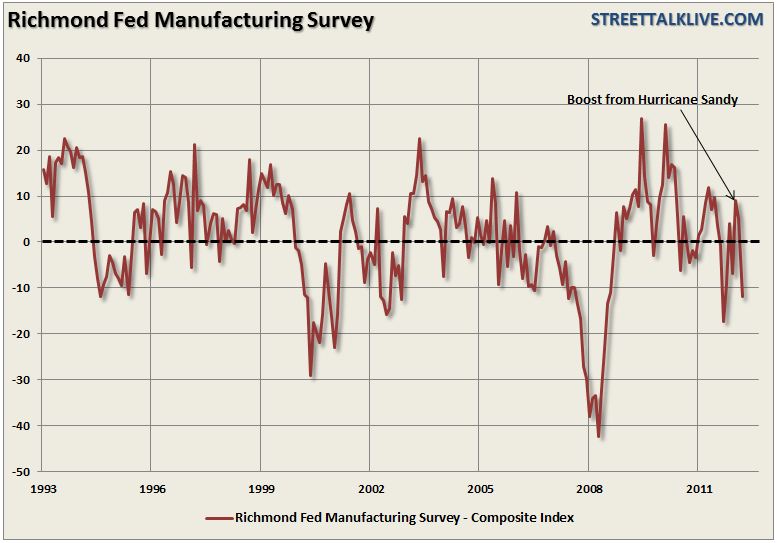
The latest release of the Richmond Federal Reserve Manufacturing Survey showed little to excited about. The current survey tacks onto the New York and Philadelphia Fed surveys showing the boost of activity, as we originally expected, from Hurricane Sandy is now fading. For the month of January the Richmond region showed a decline to -12 after two previous months of gains.

The chart of the composite index, however, doesn't really show the underlying weakness in the subcategories. The chart of the day, shown below, compares the changes between the January 2012 and 2013 surveys.

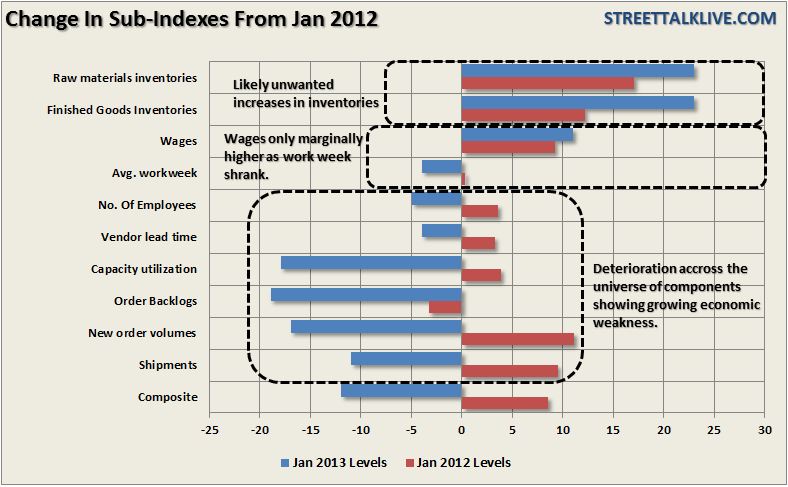
Weakness has accelerated accross the entire spectrum of the survey. New Orders, at -17, are down substantially in the recent month and are sharply lower from this time last year. Backlogs are also being depleted at -19. The absence of orders points to future weakness for shipments and employment both of which, at -11 and -5, already show contraction for January. Adding to the woes of higher taxes hitting paychecks an additional concern to future consumption trends is the declining workweek while wages are only marginally higher than they were a year ago failing to keep pace with inflation.
Inventories have continued to increase, which when compared to the drag in New Orders and Backlogs, suggest that the builds are likely unwanted. This impacts future profitability and also keeps businesses on the defensive. Capacity Utilization, currently at -18, has plummeted over the last year as end demand has stagnated.
While there have been many articles suggesting that the turn in the economy is upon us - the trend of the data on many fronts suggest otherwise. As we stated in the previous post:
Last winter was the warmest winter on record in 65 years which skewed much of the seasonal data by allowing work to continue when normally workers would have been shut in due to inclement weather. We are seeing the exact same anomalies occur currently as this is currently the warmest winter in the last 55 years, and when combined with lower energy prices, is giving a temporary boost to incomes. The skews to seasonal adjustments will also boost economic reports to seem better than they actually are. As we witnessed in 2012 - when the seasonal adjustments come back into alignment in the spring the drop off in reported economic activity will be fairly severe.
Is the recent rally being driven by expectations of a strong economy ahead or is it just the continued chase of stimulus fueled asset prices? That is up for you to decide. For me the evidence seems pretty clear that the economy remains very weak. Of course, if the economy was truly improving we would have no need for monthly injections of $85 billion...would we?

The chart of the composite index, however, doesn't really show the underlying weakness in the subcategories. The chart of the day, shown below, compares the changes between the January 2012 and 2013 surveys.

Weakness has accelerated accross the entire spectrum of the survey. New Orders, at -17, are down substantially in the recent month and are sharply lower from this time last year. Backlogs are also being depleted at -19. The absence of orders points to future weakness for shipments and employment both of which, at -11 and -5, already show contraction for January. Adding to the woes of higher taxes hitting paychecks an additional concern to future consumption trends is the declining workweek while wages are only marginally higher than they were a year ago failing to keep pace with inflation.
Inventories have continued to increase, which when compared to the drag in New Orders and Backlogs, suggest that the builds are likely unwanted. This impacts future profitability and also keeps businesses on the defensive. Capacity Utilization, currently at -18, has plummeted over the last year as end demand has stagnated.
While there have been many articles suggesting that the turn in the economy is upon us - the trend of the data on many fronts suggest otherwise. As we stated in the previous post:
Last winter was the warmest winter on record in 65 years which skewed much of the seasonal data by allowing work to continue when normally workers would have been shut in due to inclement weather. We are seeing the exact same anomalies occur currently as this is currently the warmest winter in the last 55 years, and when combined with lower energy prices, is giving a temporary boost to incomes. The skews to seasonal adjustments will also boost economic reports to seem better than they actually are. As we witnessed in 2012 - when the seasonal adjustments come back into alignment in the spring the drop off in reported economic activity will be fairly severe.
Is the recent rally being driven by expectations of a strong economy ahead or is it just the continued chase of stimulus fueled asset prices? That is up for you to decide. For me the evidence seems pretty clear that the economy remains very weak. Of course, if the economy was truly improving we would have no need for monthly injections of $85 billion...would we?
