By Pinchas Cohen
Copper, sometimes called the red metal, is red hot right now. Its price has surged to the highest level for the metal in more than two years.
While the immediate beneficiaries are producers such as Australian-British multinational metal miner Rio Tinto (NYSE:RIO), copper – alongside the biggest oil upleg since November – is leading the rally in commodities and global indices.
An industrial metal used for manufacturing and construction, copper took off after the IMF raised its growth expectations for China—for the remainder of this year and the next.
There some irony for the US economy in copper's recent gains. Once a hot commodity because of Trump’s infrastructure plans, the metal fell as markets gave up on the US President's agenda becoming reality. But now, thanks to more aggressive growth expectations for China, it's on the move again.
Yesterday, Caterpillar (NYSE:CAT) reported during its earnings release that Chinese infrastructure equipment was responsible for a 10 percent boost in its second quarter revenue, leading shares to their highest level since March 2012.

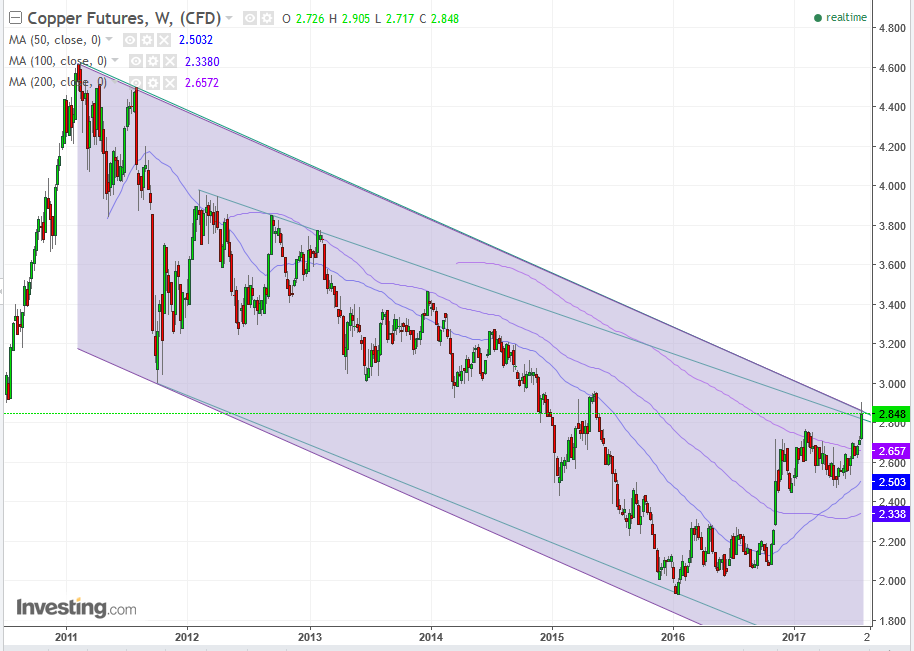
Copper has been trading within a falling channel since February 2011. Since August of that year, it wasn't even able to approach the top of the channel, that is, until yesterday. Today, it crossed above the top, forming a daily shooting star, suggesting a decline.
Some form of price consolidation is due in any case, whether it remains within a downtrend (even though it reached the resistance of its downtrend line) or if investors believe it already bottomed and will continue to rise, since it gained 4 percent yesterday, reaching its highest level since May 2015.
The 78.28 daily RSI is the most oversold since November, though its 65.68 weekly RSI is far below the 72.5 weekly RSI of the same time. It's even below the previous, January 2.770 peak. This divergence may suggest a short term correction, even if it may cause a trend shift in the longer-term.
Rio Tinto Gets A Boost Off Copper
Along with it being one of the top 10 global copper producers, Rio Tinto is making headlines, and not in a good way. The financial media is focusing on a corruption investigation over its Guinea operations, after company emails alluded to contractual payments to an unidentified consultant relating to its project in the Simandou mountains, which contain the world’s largest untapped iron ore deposits.
The company says it conducted an internal investigation after it became aware of the emails in August. The executive involved has been fired and Rio Tinto has pledged to cooperate fully with the authorities.
That seemed to be good enough for investors, who yesterday boosted the stock by 5.2 percent, with a close that was 4.65 percent higher. Perhaps the rush on copper drowned out the negative news, or maybe savvy investors took advantage of Rio Tinto's industry leading fundamentals to acquire shares on this copper boom.
Of the top five copper producers, only Freeport-McMoran (NYSE:FCX) beat Rio, soaring 14.75 percent on the prospect of securing a new mining agreement with the Indonesian government for its local copper mine. The remaining three, top copper mining stocks advanced less: Anglo American (OTC:NGLOY) rose only 1.2 percent, Southern Copper (NYSE:SCCO) gained 3.15 percent and BHP Billiton (NYSE:BHP) moved higher by 3.43 percent.
Another reason Freeport shares rose nearly three times those of Rio, is the fact that the good news on the stock follows a period of it being under-owned. This is an odd assessment, considering that all five top copper stocks gained by percentages in the mid-teens since the May bottom. Either way, Freeport’s triple surge makes it the most over-owned stock right now among its peers.
Rio’s Fundamentals
- Yearly EPS of 255.30
- Return on Equity of 12.05 – profits generated from shareholder capital
- Return on Invested Capital of 6.45, dividing Net Income – Dividends by Total Capital Invested
- Return on Assets of 5.28, measuring net income from total company assets, revealing how quickly a company can turn its assets into profits
- Rio Tinto may also pay a $1 billion special dividend, to be announced when it reveals H1 profits in August, on lower capex, cost cutting and commodity prices rebounding.

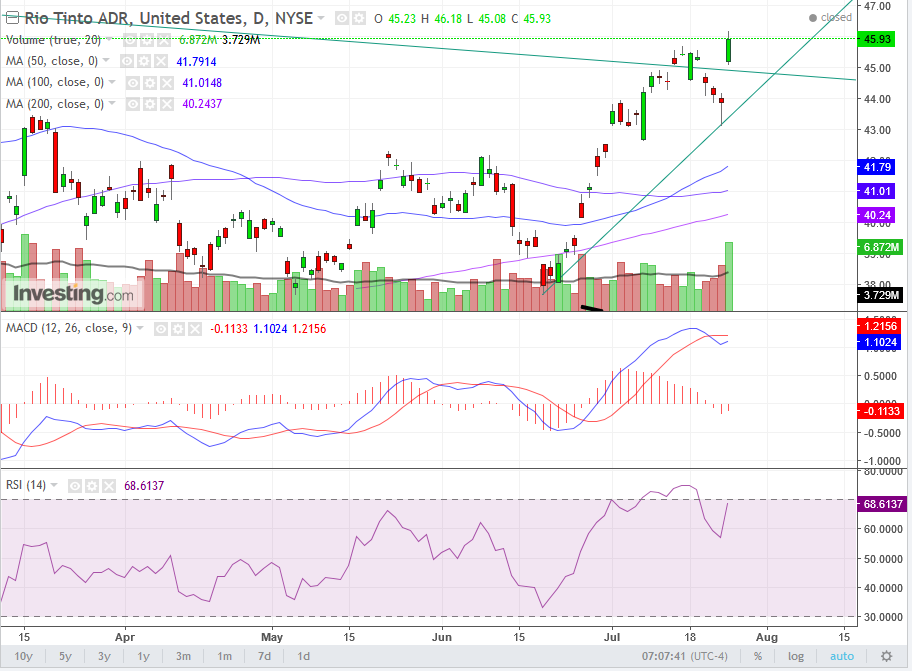
The stock has been trading within a downward trend since February 2011. On July 14, the price crossed above this 6.5-year downtrend line for the first time. However, it fell back below it. Yesterday, it gapped up, crossing again over the downtrend line, and perhaps more importantly, overcoming the prices of the initial failed upside breakout. Notice that the initial breakout was on diminishing volume, while yesterday’s breakout was on the highest volume since March.
While the price didn’t enjoy the support of participation before, it does now. The 50 dma crossed over the 100 dma, which crossed over the 200 dma – a double “golden cross,” which demonstrates the multi layered parameter of a rising trend. The last time this happened, in August, the price advanced over 40 percent, from $33 to $46, in the five months leading up to February.
On the other hand, the MACD provided a sell signal, when its slower moving average crossed below its faster moving average, and the RSI seemed to have completed an oversold top.
Trading Strategies
Conservative traders would avoid a “bull trap” by waiting on a long position for the end of the advance and the correction to follow – which should be confirmed by diminishing volume – during which time the MACD and RSI should cool down.
Moderate traders may wait on a long position for a correction toward the intersection of the short-term rising uptrend since June 20 and the violated long-term downtrend line since February 2011, in the mid $44 area.
Aggressive traders would enter a long position now, with a stop-loss beneath $44.
Very Aggressive traders may enter a short position now, against the trend, with a stop loss above yesterday’s $46.18 high, hoping for a correction, before entering long when it turns back up.
