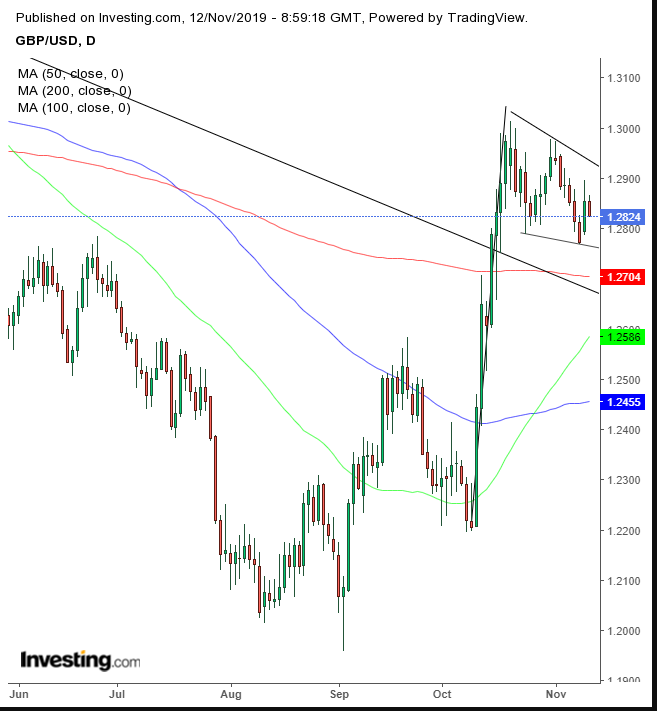
Sterling is gearing up for another leg higher, after UK Prime Minister Boris Johnson boasted over the weekend that every Tory candidate supports his Brexit deal. His swagger seems to have ended a pause in Cable's uptrend and injected some energy back into pound bulls' efforts.
His promises to business leaders at a conference today, that "the Tories will put an end to Brexit 'uncertainty and confusion' if they win next month's general election." will likely lift the currency further. That is if FX markets believe him.

The price of the GBP/USD pair is up 0.45%, trading near the session’s highs. However, more important than that, the move broke the topside of its range, forming a flag, the characteristics of which highly suggest a continued upswing.
A flag represents a pause after a dynamic market move. This occurs when traders need to take a breath, in this case after the 6% move in just six days, from Oct. 10-17. They take profits and wait for further developments.
That's when new bulls come in to lift the load further, while their trading predecessors take a break. Bears put up a show of force, but the upside breakout demonstrates that bulls far outnumber bears. Once everyone sees which way the supply-demand balance is headed, losers generally run for the hills.
Was the breathtaking jump warranted or did the market get ahead of itself? Consider this:
- The flag pole, the sharp move preceding the flag development, cut through the downtrend line since April 2019 like hot butter. The body of the flag developed atop of the downtrend line, suggesting the market is regaining forces after getting through the psychological barrier.
- The 200 DMA climbed above the downtrend line as well, signifying a broad spectrum of prices scaled above the line that has been representing a downtrend since before mid-last year.
- The 50 DMA is surging, taking on the 200 DMA, gearing up for a Golden Cross.
Trading Strategies – Long Position Setup
Conservative traders would wait for a 3% upside move from the pattern, a close above 1.3300, to avoid a bull trap. That projection fits with the March highs, prices at which traders are likely to take profit. Then, they’d wait for a pullback to prove the uptrend via a consolidation above the flag.
Moderate traders may likely be content with a 2% filter, in order to feel confident enough to rely on the outbreak, and a close above 1.3200. Then, they may wait for a correction, for a better entry, not necessarily in order to retest support.
Aggressive traders may go long after the price closes above 1.3050, clearing the psychological round number, as well as getting a 1.00% filter, to reduce the odds of a bull trap. Then, they could wait for a pullback, for a better entry, dependent upon their trade strategy.
Trade Sample
- Entry: 1.2950
- Stop-Loss: 1.2850
- Risk: 100 pips
- Target: 1.3250
- Reward: 300 points
- Risk:Reward Ratio: 1:2
Which stock should you buy in your very next trade?
AI computing powers are changing the stock market. Investing.com's ProPicks AI includes 6 winning stock portfolios chosen by our advanced AI. In 2024 alone, ProPicks AI identified 2 stocks that surged over 150%, 4 additional stocks that leaped over 30%, and 3 more that climbed over 25%. Which stock will be the next to soar?
Unlock ProPicks AI