Bitcoin price today: gains to $120k, near record high on U.S. regulatory cheer
About 30% of US retail sales occur between Black Friday, the day after the November Thanksgiving holiday, and Christmas on Dec. 25. That’s almost one third of all annual sales in the country, being rung up just under a month.
Despite—and perhaps even because of—COVID-19, we can expect an increase in shopping traffic as bricks-and-mortar stores will likely pull out all the stops to try and recoup this year's losses, as well as compete with online shopping outlets which have been boosting their market shares because of the pandemic's stay-at-home environment.
While most traders will likely focus on retail names, there's one less-obvious sector that could also see gains. With people out shopping on Black Friday and into the weekend, indeed perhaps until Christmas, a place where one can eat quickly and rest before resuming shopping might also see financial benefits.
Which puts the focus on one always popular chain—McDonald’s (NYSE:MCD).

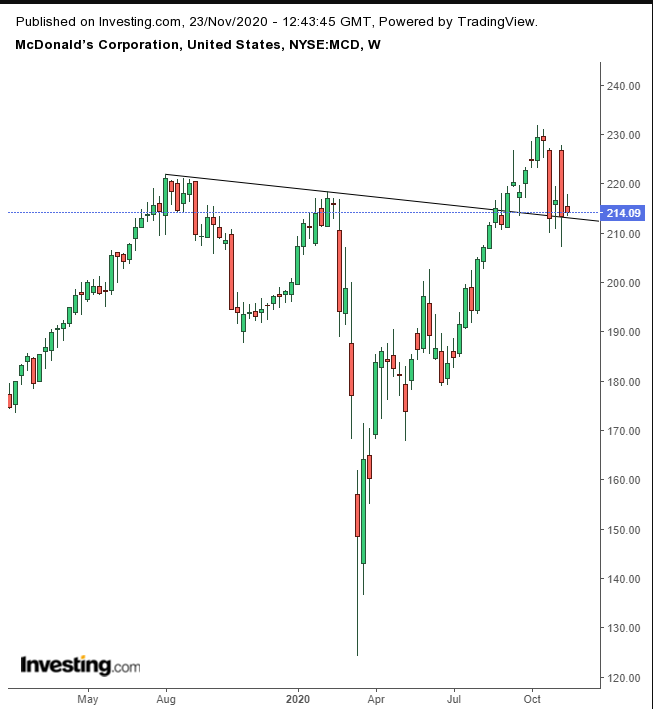
It so happens that McDonald’s just confirmed a major support line above $210 at its present angle, for the fourth straight week, the neckline of a massive bottom in place since August 2019.
The proximity of the price to the support provides an exceptional risk-reward ratio. The neckline connects the highs of a pattern in which the supply-demand balance—after making repeated sharper, lower troughs (while only forming moderately lower peaks)—has made both higher lows and higher highs, demonstrating that the force of the trend has reversed.
Trading Strategies
Conservative traders should wait for a new high to blow out the small H&S top that may be developing.
Moderate traders may be content with a close back above the rising channel since the end of March.
Aggressive traders might risk a long position to take advantage of an exceptional risk-reward ratio, since the stock is so near the support, relative to the first resistance of the October highs. However, a trade plan is necessary to cut losses and maximize gains. Here’s an example:
Trade Sample
- Entry: $210
- Stop-Loss: $208, the November low
- Risk: $2
- Target: $230, round number below October highs
- Reward: $20
- Risk:Reward Ratio: 1:10
Which stock should you buy in your very next trade?
With valuations skyrocketing in 2024, many investors are uneasy putting more money into stocks. Unsure where to invest next? Get access to our proven portfolios and discover high-potential opportunities.
In 2024 alone, ProPicks AI identified 2 stocks that surged over 150%, 4 additional stocks that leaped over 30%, and 3 more that climbed over 25%. That's an impressive track record.
With portfolios tailored for Dow stocks, S&P stocks, Tech stocks, and Mid Cap stocks, you can explore various wealth-building strategies.

