We have been bearish on U.S. equities for a few months now. We think traders are being overly optimistic about the Fed's tightening cycle, the China-U.S. trade negotiations, Brexit and U.S. politics. President Trump's statements that the U.S. and China may reach a trade agreement, but then again may not, have hit the optimism that pushed stocks up yesterday. This morning, futures on the S&P 500, Dow and NASDAQ 100 joined a global equity selloff and swung back to risk-off.
Fed Chair Powell testifies today to the Senate Banking Committee; tomorrow he'll testify before the House Financial Services Committee. Hopefully, he'll provide some clarification on whether earlier statements that the Fed will be “patient” with higher interest rates were meant to indicate a policy shift, or whether it was simply down to insufficient data due to the government shutdown. The same goes for the central bank’s “flexibility” over its bond holdings.
The market's understanding of the Fed's stance, plus on-again/off-again optimism about China-U.S. trade, have helped stocks recover since the Christmas Eve slump, but the technicals suggest this could be changing soon.

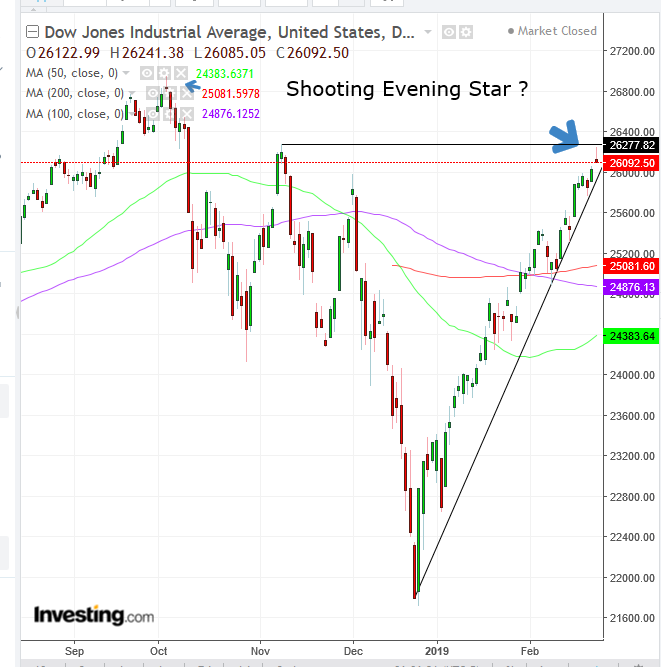
The Dow Jones Industrial Average closed 0.23% higher, at 26,091, after going through the same pattern as the S&P 500, closing well above highs. Technically, it formed a shooting star which, with an up-gap, could prove to be an Evening Star in Japanese Candlesticks or an Island Reversal in Western methodology.
The price is up 19.7% since the pre-Christmas bottom, after having fallen 18.54% since the Oct. 2, 26,828.39 record-peak which, incidentally, was a shooting Evening Star, as well. Also, worth considering, the RSI is retesting the overbought 70 level since last week, having reached the highest levels since the record peak.
Trading Strategies
Conservative traders would wait for clarity on the short-term trend, with either a fresh record peak or for a new low, below the Christmas bottom.
Moderate traders may enter a long position if prices close above the 26,277.82, Nov. 8 high. Alternatively, they may enter a short position if the short-term trend posts a descending series of peaks and troughs, which should take the price back below the 200 DMA.
Aggressive traders may risk a short position, if prices gap down and close at least well within Friday’s up-day, completing an Evening Star, a bearish reversal signal, which would include penetrating through the uptrend line since the Christmas bottom. Ideally, they would wait for a pullback for a better entry.
Trade Sample
- Entry: 26,000
- Stop-Loss: 26,250, above yesterday’s high price
- Risk: 250 points
- Target: 25,250
- Reward: 750 points
- Risk-Reward Ratio: 1:3
Which stock should you buy in your very next trade?
With valuations skyrocketing in 2024, many investors are uneasy putting more money into stocks. Unsure where to invest next? Get access to our proven portfolios and discover high-potential opportunities.
In 2024 alone, ProPicks AI identified 2 stocks that surged over 150%, 4 additional stocks that leaped over 30%, and 3 more that climbed over 25%. That's an impressive track record.
With portfolios tailored for Dow stocks, S&P stocks, Tech stocks, and Mid Cap stocks, you can explore various wealth-building strategies.

