The US dollar lost some ground but held relatively steady on Thursday, considering the several powerful forces at play that could have given bears free rein.
The European Commission revealed plans on Wednesday to reduce its dependence on the greenback, particularly in the energy sector, where 28-nation bloc seeks to continue to trade with Iran despite US sanctions. This plan accelerates the EC's long-term goal to challenge the use of the USD as the currency base for the world economy, which includes creating euro-denominated energy contracts and price benchmarks for crude oil. The move would follow the launch by China of oil futures contracts denominated in yuan back in March, when the country's trade dispute with the US was just starting.
Given China and the EU are the world's largest oil importers, any shift to non-USD commodity contracts would significantly affect demand for the US dollar. If we add to that ongoing plans by global central banks to increase their euro reserves at the expense of the US dollar, in response to US President Donald Trump’s aggressive foreign policy and rhetoric, it's easy to see why the greenback could take a devastating hit.
During the Asian session, the buck was seen losing some ground while the yen edged higher, as global stocks continued to slump on the arrested of Huawei's CFO on Saturday over potential violations of sanctions against Iran. On one side, this development is likely to accelerate foreign countries' motivation to lower the US dollar's influence over their foreign and economic policy. On the other side, it stands to increase tensions between the US and China at a time when the two countries were expected to confirm a trade tariffs ceasefire. Another event that could jeopardize trade negotiations is the fact that, today, the yuan posted its biggest jump since October. The renminbi's value has been one of the main drivers of Trump's recent trade strategy with China.

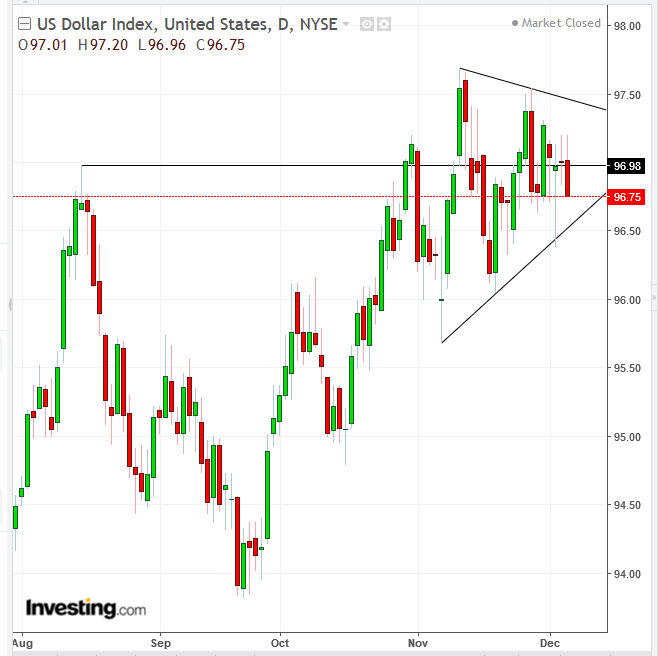
The US dollar has been trading within a symmetrical triangle since early last month. The pattern demonstrates that both buyers and sellers are upping the ante, which is why they are inching closer to each other, at the apex.
While analysts could attempt to quantify various fundamental, geopolitical and macroeconomic drivers to weigh the value of the dollar relative to peers, trying to understand why both buyers and sellers are convinced they are right, we can offer a technical explanation.
Traders may remember the fact that prices fell 3.27% from the Aug. 15-peak of 96.98.to the Sept. 21 low of 93.83, and conclude that this rate is too high for the currency and expect it return to what they consider is its real value. Others may find the greenbacks positive interest rate differential and its haven status appealing enough to offset concerns of the previous decline from this price level.
Either way, the 97 level has become a line in the sand for traders and the August peak is right at that apex. While the triangle's symmetry suggests equal force to supply and demand, its trend indicates a greater likelihood for an upside breakout, and does suggest the 50 DMA (green) support, while the 100 DMA supports the mid-term uptrend.
Trading Strategies – Long Position Setup
Conservative traders should wait for a decisive upside breakout, including a filter to limit the risk for a bull trap, followed by a return move that confirms the pattern’s integrity. One gauge to a sufficient penetration of the pattern is a new peak passed the Nov. 12, 97.69 high.
Moderate traders may be content with a close above the 97.54 level posted on Nov. 28. Then, they may wait for a potential return move for a better entry.
Aggressive traders may enter a long position now, using the Aug. 15 peak of 96.98 as a jump-off point, as today's low of 96.96 respected the Aug. 15 96.98 support, as it bounced back above it.
Trade Sample 1:
- Entry: 96.85
- Stop-loss: 96.75, below yesterday's low
- Risk: 10 pipsTarget: 97,20
- Reward: 35
- Risk-Reward Ratio: 1:3
Trade Sample 2:
- Same entry and stop-loss
- Target (NYSE:TGT): 99.40, implied by pattern height and below 100 round psychological number
- Reward: 240 pips
- Risk-Reward Ratio: 1:24
