🏄 Grow your portofolio even on vacation with InvestingPro | Summer Sale 50% OFFCLAIM SALE

Chart Of The Day: As It Tumbles, There's Reason To Grow More Bullish On Bitcoin

Published 01/11/2021, 09:34 AM

After spending the weekend trading above the $40,000 level, Bitcoin is lower today, at time of writing around $35.1K. That's a drop of almost 14% in one day, a loss of almost 18% over the past two days.

This steep tumble has generated such headlines as “Two-Day Bitcoin Plunge Shakes Faith in Cryptocurrency Boom” and “Bitcoin's Wild Weekends Turn Efficient Market Theory Inside Out.” We can't vouch for shifting investor sentiment on the digital asset, nor do we have any idea what the cryptocurrency could be worth a year from now. But we do know it's becoming increasingly more closely watched.

JP Morgan might be correct in their call that the token will surge to $146,000 in the long-term, competing with gold as an 'alternative' currency. On the other hand, as Bank of America asserts this Bitcoin rally may just be the “mother of all bubbles.”

From the outset we've been uneasy with the entire concept of digital currency. However, it appears that this market disregards physical value. So Airbnb (NASDAQ:ABNB), which has no physical real estate holdings, was worth more than the three largest hotel operators after its IPO, albeit without assets. Even though it’s just a website that gets booking commissions.

And electric carmaker Tesla (NASDAQ:TSLA) has a market cap that's higher than the seven largest conventional carmakers combined, though it’s expected to sell fewer than 1% of total global vehicles. Similarly, Bitcoin is worth over $34,000, after a decline that has triggered some panic, while physical gold costs $1,847.

3rd party Ad. Not an offer or recommendation by Investing.com. See disclosure here or remove ads.

Still, though we're bemused by any asset that doesn't have a physical component, we won’t fight the trend. And since we’re going with the trend, it's clearly up. After Bitcoin's value doubled in three weeks, why would anyone be surprised by profit-taking? Plus, Bitcoin has always had a history of volatile price swings. After all, only a few weeks ago it was valued at $20,000 and that seemed breathtaking at the time.

Of course, a very large move lower could scare investors into a stampede. But our perspective has been, when everyone was gung ho about Bitcoin, we were suspicious of complacency. So, now that panic-inducing headlines are scaring the crowd, we feel more comfortable assuming a managed risk in favor of the cryptocurrency.

Here's what the balance of supply and demand currently looks like:
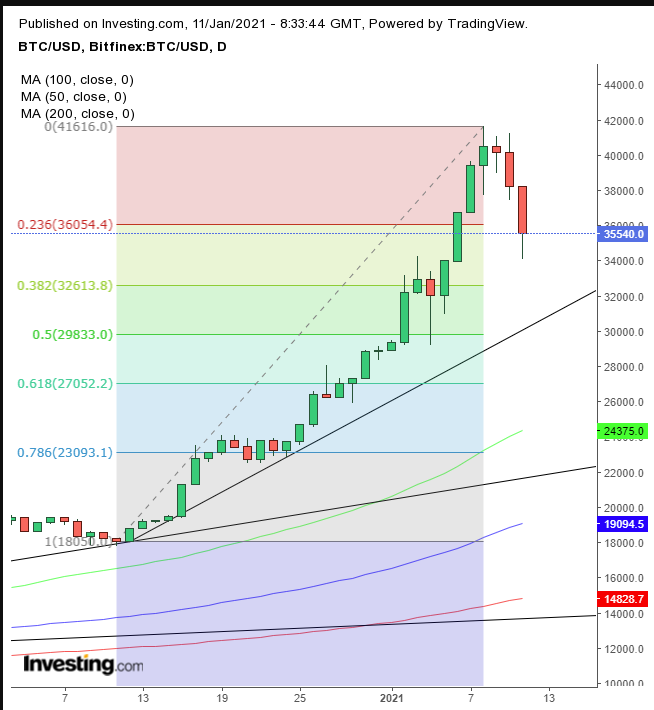
BTC/USD Daily

Bitcoin has been continuously accelerating the pace of its advance. So now, falling is not a bad thing.

Indeed, Bitcoin enthusiasts should want the cryptocurrency to decline, so that anyone who wants to cash out can do so and allow others to pick up the mantle.

It’s more dangerous when an asset spikes up, because the more it gains the greater the hazard of a correction, as more people attempt to lock in profits.

Although we don’t tend to use Fibonacci retracements, we found it noteworthy that the price found support at 0.382, the minimum retracement level.

3rd party Ad. Not an offer or recommendation by Investing.com. See disclosure here or remove ads.

Note, the 50 DMA is moving up toward the current rising trend line, while the 100 DMA rises to support the second uptrend line, at $22,200, and finally the 200 DMA retraced the shallowest uptrend line on this chart, at $14,000.

The sharper the dip to these levels, the better the risk-reward ratio, though the price may not get that far. That’s the trade-off between risk and reward.

Trading Strategies

Conservative traders would wait for the price to create a base of support and trade off that.

Moderate traders may risk a long position if the price bounces off the uptrend line.

Aggressive traders might trade off the 0.382 Fibonacci rebound, provided they understand and accept the risks and are accordingly committed to a trade plan.

Here’s an example:

Trade Sample – Long Position Setup

  • Entry: $34,700
  • Stop-Loss: $33,700
  • Risk: $1,000
  • Target: $44,700
  • Reward: $10,000
  • Risk:Reward Ratio: 1:10

Which stock should you buy in your very next trade?

With valuations skyrocketing in 2024, many investors are uneasy putting more money into stocks. Unsure where to invest next? Get access to our proven portfolios and discover high-potential opportunities.

In 2024 alone, ProPicks AI identified 2 stocks that surged over 150%, 4 additional stocks that leaped over 30%, and 3 more that climbed over 25%. That's an impressive track record.

With portfolios tailored for Dow stocks, S&P stocks, Tech stocks, and Mid Cap stocks, you can explore various wealth-building strategies.

Unlock ProPicks AI
Read Next

Latest comments

Beginner TraderJan 12, 2021, 07:20
Pinchas, thanks for the great analysis and keep up the great work! I have learned so much from you reading your Chart of the Day posts!
Pinchas CohenJan 12, 2021, 12:03
Thanks, Beginner. Really appreciate the feedback! I hope I will keep providing you with material that helps you grow! Happy Trading!
Barry MeadsJan 12, 2021, 00:41
Pinchas, great article, as ever, Many thanks. You're article got me thinking... 1. Generally, when facing a potential stampede (appreciate it's impossible to catch a falling knife and predict a bottom), where do you think logical resistance points would be? Looking at BTC in this chart, won't the rising trend line be a better entry point for e.g.? 2. But then, why would even a trend line be more valid than a DMA? so would the 50 DMA not be a more logical resistance level? As we've seen in the past, trend lines an DMAs have historically provided resistance/support levels. So when facing price action heading towards them, which do you favour? My question essentially is to do with resistance levels: Which do you think are most valid and why? And when seeing a rally up or down, where do you think most logical resistance levels lie?  Any pointers to literature around them will also be greatly appreciated - I'd like to find out more about them. Thanks!
Pinchas CohenJan 12, 2021, 12:02
On point, why would a MA or a trend line have any predictive powers, if not because of their self-fulfilling prophecies? Therefore, study a particular's asset to determine what has been more true for it, and be prepared to change your mind as it develops. In the final analysis, I prefer a horizonal support and resistance, because it's constant. That means that more people and across different disciplines remember that price and have a dog in that fight. As to books, I don't know what you read, but I am a big believer to first get the basics and really understand them, before attempting any of the fancy stuff. Therefore, the easier the better. Technical Analysis of the Financial Markets by John Murphy was one of my favorite early ones. Happy trading!
Pinchas CohenJan 12, 2021, 13:41
Finally, technical analysis attempts to gauge the supply and demand and therefore doesn't act in a vacuum. If you find additional technical supports/resistance and indicators confirming an uptrend line or a MA, the odds increase that it's more representative.
Barry MeadsJan 14, 2021, 23:00
 Thank you v v much for the detailed reply. It has really helped. And thanks for the recommendation on the book!
Show all comments
Loading next article…
Risk Disclosure: Trading in financial instruments and/or cryptocurrencies involves high risks including the risk of losing some, or all, of your investment amount, and may not be suitable for all investors. Prices of cryptocurrencies are extremely volatile and may be affected by external factors such as financial, regulatory or political events. Trading on margin increases the financial risks.
Before deciding to trade in financial instrument or cryptocurrencies you should be fully informed of the risks and costs associated with trading the financial markets, carefully consider your investment objectives, level of experience, and risk appetite, and seek professional advice where needed.
Fusion Media would like to remind you that the data contained in this website is not necessarily real-time nor accurate. The data and prices on the website are not necessarily provided by any market or exchange, but may be provided by market makers, and so prices may not be accurate and may differ from the actual price at any given market, meaning prices are indicative and not appropriate for trading purposes. Fusion Media and any provider of the data contained in this website will not accept liability for any loss or damage as a result of your trading, or your reliance on the information contained within this website.
It is prohibited to use, store, reproduce, display, modify, transmit or distribute the data contained in this website without the explicit prior written permission of Fusion Media and/or the data provider. All intellectual property rights are reserved by the providers and/or the exchange providing the data contained in this website.
Fusion Media may be compensated by the advertisers that appear on the website, based on your interaction with the advertisements or advertisers.
© 2007-2025 - Fusion Media Limited. All Rights Reserved.