It may have finally happened—gold appears to have bottomed out. Lately, the precious metal's status as a safe haven has been somewhat diminished, a result of rising interest rates and the strengthening dollar.
Thursday's equity plunge, however, in tandem with the weakening USD, gave gold the push it needed to resume its climb and perhaps reclaim its position as the safe harbor when risk-off sentiment permeates markets.

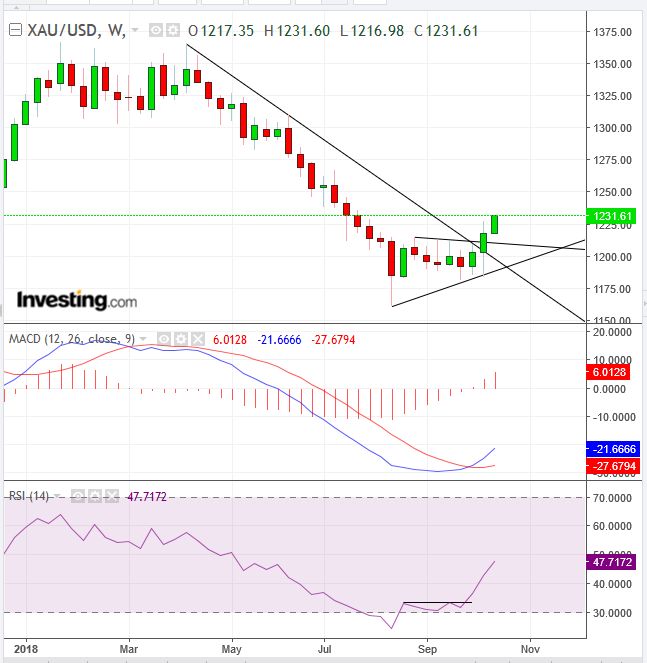
The price of gold has been consolidating in an ascending triangle, ever since the $1,160.56, August 15 bottom. The pattern demonstrates that demand is outpacing supply and is, therefore, an apt bottom reversal pattern.
A psychological reversal takes effect when buyers are willing to raise their bid, which they recently did—from $1,160 in mid-August to $1,180 in late September. At the same time, sellers were not as eager, ready to sell only above $1,210. Since buyers were more committed than sellers, they absorbed all the supply in the pattern, which forced them to raise their bid to seek out new sellers, resulting in the upside breakout. The fact that the pattern breakout coincided with scaling above the downtrend line since mid-April further increases the outlook for a reversal.
The RSI demonstrated that momentum was behind the price move, as the Relative Strength Index jumped above its consolidation, from the most oversold condition since mid-2013. The MACDs shorter MA crossed above its longer MA, from below the zero line, providing a meaningful buy signal, for the first time since January 2017.
Trading Strategies – Long Position Setup
Conservative traders should wait for a minimum 3 percent penetration of the upper bound of the triangle at $1,211.00, to avoid a bull trap. So far, the penetration has reached 1.7 percent. Then, they should wait for a likely return move to retest the pattern’s support, with at least one long green candle following a red or small candle of any color. Finally, they should wait for another retest of the pattern for a closer entry and lower risk.
Trade Sample:
- Entry: $1,220, upon a correction to $1,210, from $1,248
- Stop-loss: $1,210, triangle top
- Risk: $10
- Target: $1,260, a $50 move, as measured by height of pattern
- Reward: $40
- Risk-Reward Ratio: 1:4
Moderate traders would wait for a 2 percent penetration of the pattern, ready for a return move, for a closer entry. The trade sample would be the same as above. The difference in risk would be for the confirmation of the breakout's reliability.
Aggressive traders may enter a position immediately, providing they accept the risk of a return move and either place a stop-loss to absorb it or lose the position.
Trade Sample:
- Entry: $1,232
- Stop-loss: $1,229, beneath the psychological, round number support
- Risk: $3
- Target: $1,260, a $50 move, as measured by the height of the pattern
- Reward: $28
- Risk-Reward Ratio: 1:9
