The debate regarding which way oil is headed next rages on. The commodity's fundamentals right now are murky.
Oil could fall if OPEC's production cap is reversed later this week in Vienna and additional supply floods markets. On the other hand, it could resume its uptrend above $70 if global economic growth should strengthen or US economic sanctions against Iran and ongoing turmoil in Venezuela diminish supply.
Goldman Sachs analysts expect prices to rise to $80. They base this on an outlook for declining inventories per the global supply-demand balance, OPEC notwithstanding.
However, the Wall Street Journal yesterday published an article whose headline declared: “Ignore the OPEC Drama, More Oil Is Coming.” The piece points out the following critical point:
“…investors who are bidding up prices in the expectation of a split are misunderstanding both the history of the cartel and the current state of the oil market."
OPEC’s nonmember Russia is currently siding with Saudi Arabia about boosting output by a reported 300,000 to 600,000 barrels a day.
Yesterday’s price jump was based solely on trader expectations that the dissenters would prevail, limiting the increase.
The Journal believes prices will rise no matter what based on game theory and history. Saudi Arabia and Russia produce five times what Iran or Iraq can and 15 times Venezuela’s output, since its oil industry is in chaos. in short, no one is in a position to stop Saudi Arabia and Russia.
However, technical analysis tells us the supply-demand balance suggests prices will continue lower.

When discussing a trend, it is first necessary to establish that the language used is clear. Which trend is in question? In the case of oil there are several trends occurring at the same time. As well, they're in potentially divergent directions, based on their time frame.
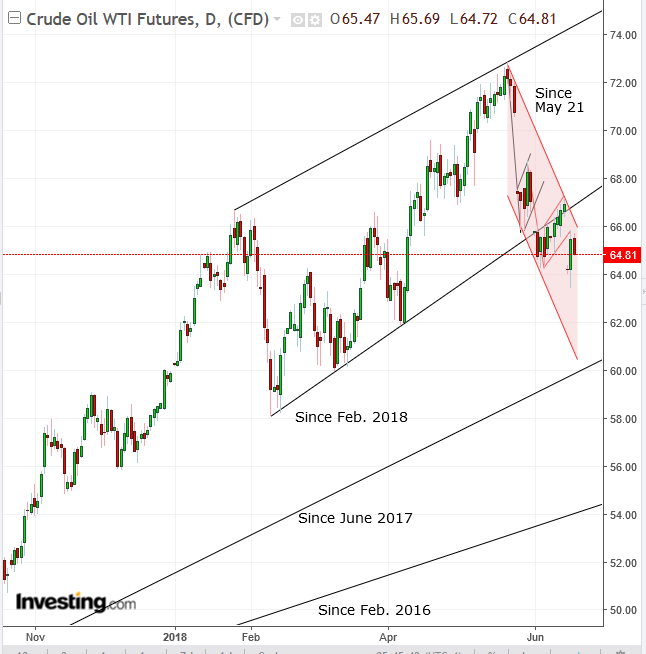
While the long-term trend since the end of February 2016, as well as that since June 2017 is up, the uptrend since February is in question. The trend since May is clearly falling.
After agreeing to debate this using the same trends, we need to establish rules for what constitutes a trend, in order not to compare apples and oranges. In technical analysis, a trend is defined by the direction of its peaks and troughs. When those rise, so does the trend; when they fall, it’s a downtrend.
Patterns are interruptions in the trend that signal either a resumption of the prevailing trend or a reversal.
Last Tuesday we forecast that a back-to-back bearish flag would complete, signaling a resumption of the downtrend since May 22, under $73. The flag developed on the very uptrend line since February 11, as both trends clashed. The flag completion provided victory to the shorter-term bearish trend.
The next struggle will be at the uptrend line since June 2017, $60 at the current angle, around the very target of each individual flag. That signifies the $60 level as the current biggest supply-demand pressure point.
For traders, the most important technical trigger is that a return move to the second flag has been complete and was successful, as it demonstrated the resistance provided by the pattern. This provides a short opportunity, based on our previous post on the subject.
