Are you a dollar bull or bear? We can't blame you if you haven't decided; even experts in the field disagree.
David Bloom, HSBC's global head of currency strategy says that the US dollar is a major buy and there is nothing to stop its bounce from continuing. He bases his analysis on the Fed’s path to higher interest rates, compounded by a healthy economy, while other central banks don’t have the luxury of following the path of the US.
On the other hand, most analysts polled by Reuters are confident the dollar’s bounce is temporary and certain to end soon. Of 60 analysts polled, nearly 60 percent, or 35 individuals, believe the greenback’s recent rise will end within three months; ten are willing to bet it will end in a month.
What's the basis for their analysis? The same factors Bloom highlights. However, this group has the opposite read.
They, too, compare the Fed’s range of activity to that of other central banks. But unlike Bloom, who thinks these non-US central banks have no leeway, the majority of these analysts believe they do. After all, just yesterday ECB chief economist Peter Praet said that the ECB will reveal during their next meeting that since inflation is on the right path there's an end in sight for European QE.
This group considers risk as a market phenomenon not yet priced in, thus a dollar downside, as other central banks could also strengthen monetary policy.

It's a conundrum for traders who are just mere mortals. For those of us in this category, technical charts can help to analyze the supply-demand balance in order to formulate a high-probability position.
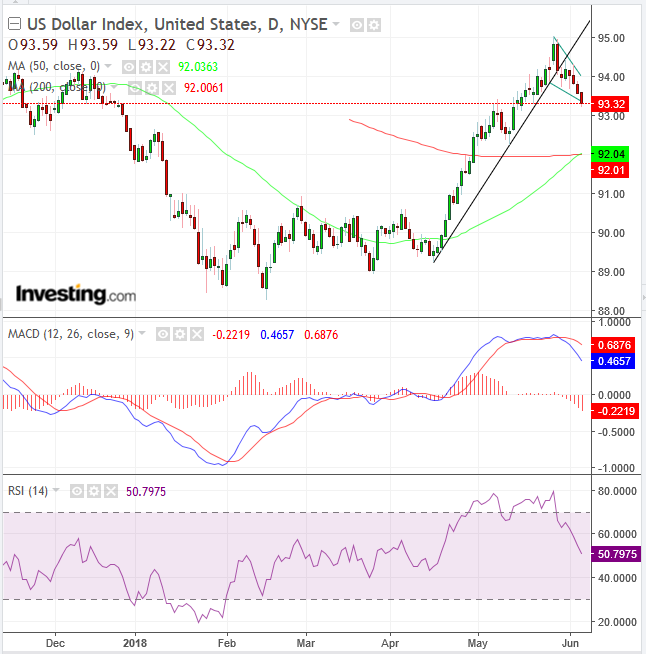
The dollar advanced 6 percent between mid-April and late May. On the heels of a 2-percent range for three months, that's a major move. Investors naturally find themselves asking if they didn’t go too far too fast.
We are now in the eighth session of consolidation. That’s when traders take profit and consider their next move. Under the right circumstances it allows new blood to come in. Someone fresh to carry prices higher.
That's the presumed psychology of a continuation pattern, such as the falling flag that has been developing over the last two weeks. An upside breakout would signal to traders who were waiting on the sidelines that the market vote has been cast: prices are going higher. However, instead, today, prices are threatening to break to the downside. That would constitute a pattern failure, meaning market dynamics reversed.
During the flag development, the 50 DMA (green) crossed above the 200 DMA (red), executing a bullish “golden cross,” demonstrating that prices are now rising. However, both the MACD and the RSI have provided sell signals, demonstrating that both shorter price data comparisons and momentum has been breaking down.
So, how to proceed? It requires patience and judgement. Unfortunately, the latter develops with experience, and it takes being wrong for a while to form that judgement. Now, it’s a waiting game. We wait for the direction of the breakout.
Should a long, full candle be bottom side of the pattern, the pattern would have failed, triggering stop-losses. Many traders, exiting positions, would withdraw demand, leaving supply a clear path to push prices lower. Former long positions will jump on the wave, pushing prices further downward.
Alternatively, an upside breakout, with at least one, long full candle, would demonstrate an outlook for higher prices. In a mirror image, those would force bears to cover shorts, which entails buying and thereby actually contributing to demand. The rest follows. So, now what?
As with the fundamental drivers espoused by the experts above, it's clear there's no reliable consensus as yet. However, good things come to traders who wait for the right signals.
