Get 40% Off
⚠ Earnings Alert! Which stocks are poised to surge?
See the stocks on our ProPicks radar. These strategies gained 19.7% year-to-date.
Unlock full list

Chart Of The Day: Treasury Yield Slump – More Bad News For Equities?

Published 03/29/2018, 10:02 AM
Updated 09/02/2020, 02:05 AM

Financial markets are structured around risk. When optimism rises, investors seek growth, but when pessimism takes hold, investors’ prime objective is preservation. Fear is a more powerful motivator than greed, as we are programmed for survival.

Therefore, it stands to reason that the yield’s slump to a 7-week low, potentially topping out – as investors rotate out of growth assets and into government security – is a flaming red flag for equities.
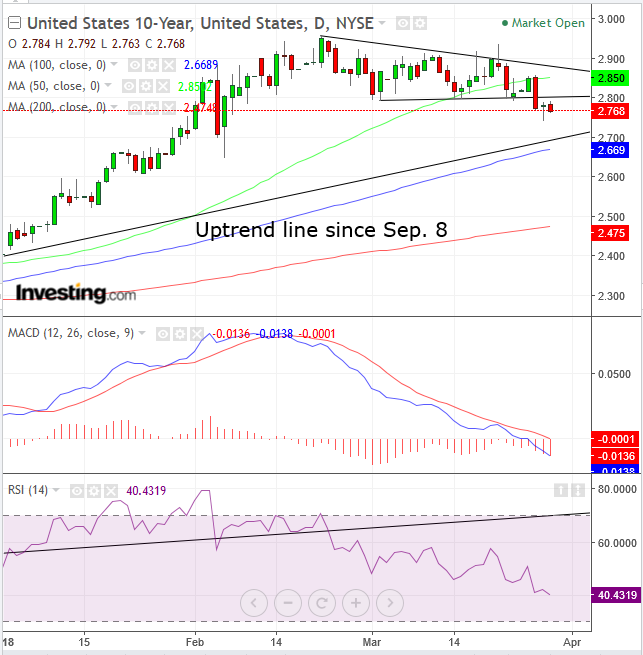
10-Year Treasury Yield Daily Chart

10-Year Treasury yields may have topped, after completing a Descending Triangle on Tuesday, which demonstrates demand over eagerness. (Normally, this pattern reflects the supply over eagerness, but yields fall as demand for their bonds rise.) The pattern’s supply dominance is expected to resume in the new, lower levels, implying a 2.64 target. The downside breakout occurred after the price retested the 50 dma (green) after crossing below four sessions prior, which has been supporting the price since September 18.

However, the uptrend line since September 8 – guarded by the 100 dma (blue) – is still intact. A close below the 2.7 level would strengthen the case for a reversal.

Still, both the MACD and the RSI have provided negative divergences, peaking ahead of the price, mid-February for the MACD lagging indicator and the beginning of February for the RSI leading indicator.
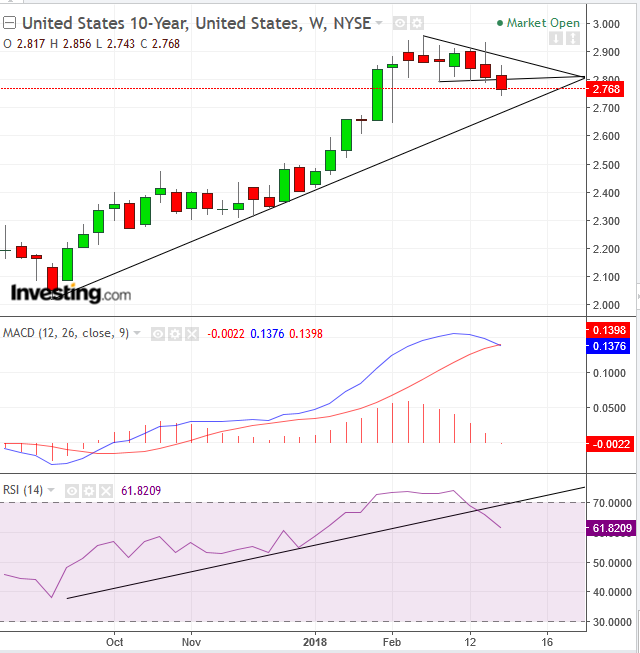
10-Year Treasury Yield Weekly Chart

While the RSI at 40 may be nearing oversold levels, on the weekly chart it just topped out from a 74-oversold level. Moreover, the MACD is providing a sell signal right now, with the shorter MA (blue), crossing below the longer MA (red).

Trading Strategies

Conservative traders would wait for a confirmation of the trend reversal, when the price falls below the long-term uptrend line and successfully retests it, with a red candle covering the preceding green candle.

Moderate traders might wait for a confirmation of the Descending Triangle’s integrity, when a return move is thwarted by the triangle’s bottom.

Aggressive traders may short now, with a stop-loss above the 2.8, triangle bottom.

Latest comments

Win&Win.... bull
Bitcoin 25000 dollar. Years 2020 may
Hi, buy more gold to support the dollar. Please comment thanks to Mehdi Amoli Moghadam: Iran
Risk Disclosure: Trading in financial instruments and/or cryptocurrencies involves high risks including the risk of losing some, or all, of your investment amount, and may not be suitable for all investors. Prices of cryptocurrencies are extremely volatile and may be affected by external factors such as financial, regulatory or political events. Trading on margin increases the financial risks.
Before deciding to trade in financial instrument or cryptocurrencies you should be fully informed of the risks and costs associated with trading the financial markets, carefully consider your investment objectives, level of experience, and risk appetite, and seek professional advice where needed.
Fusion Media would like to remind you that the data contained in this website is not necessarily real-time nor accurate. The data and prices on the website are not necessarily provided by any market or exchange, but may be provided by market makers, and so prices may not be accurate and may differ from the actual price at any given market, meaning prices are indicative and not appropriate for trading purposes. Fusion Media and any provider of the data contained in this website will not accept liability for any loss or damage as a result of your trading, or your reliance on the information contained within this website.
It is prohibited to use, store, reproduce, display, modify, transmit or distribute the data contained in this website without the explicit prior written permission of Fusion Media and/or the data provider. All intellectual property rights are reserved by the providers and/or the exchange providing the data contained in this website.
Fusion Media may be compensated by the advertisers that appear on the website, based on your interaction with the advertisements or advertisers.
© 2007-2024 - Fusion Media Limited. All Rights Reserved.