The YM, ES, NQ & TF are in the process of backtesting the underside of their rising channel, as shown on the Daily charts below.
The TF has already penetrated the channel and leads in strength on this bounce over the past three days. The NQ closed just inside the channel today (Thursday)...one to watch over the next few days to see if it can remain in the channel. A failure to remain in the channel and follow through now on a sustained and convincing bounce will cause me to assume that selling is not yet finished in the short term.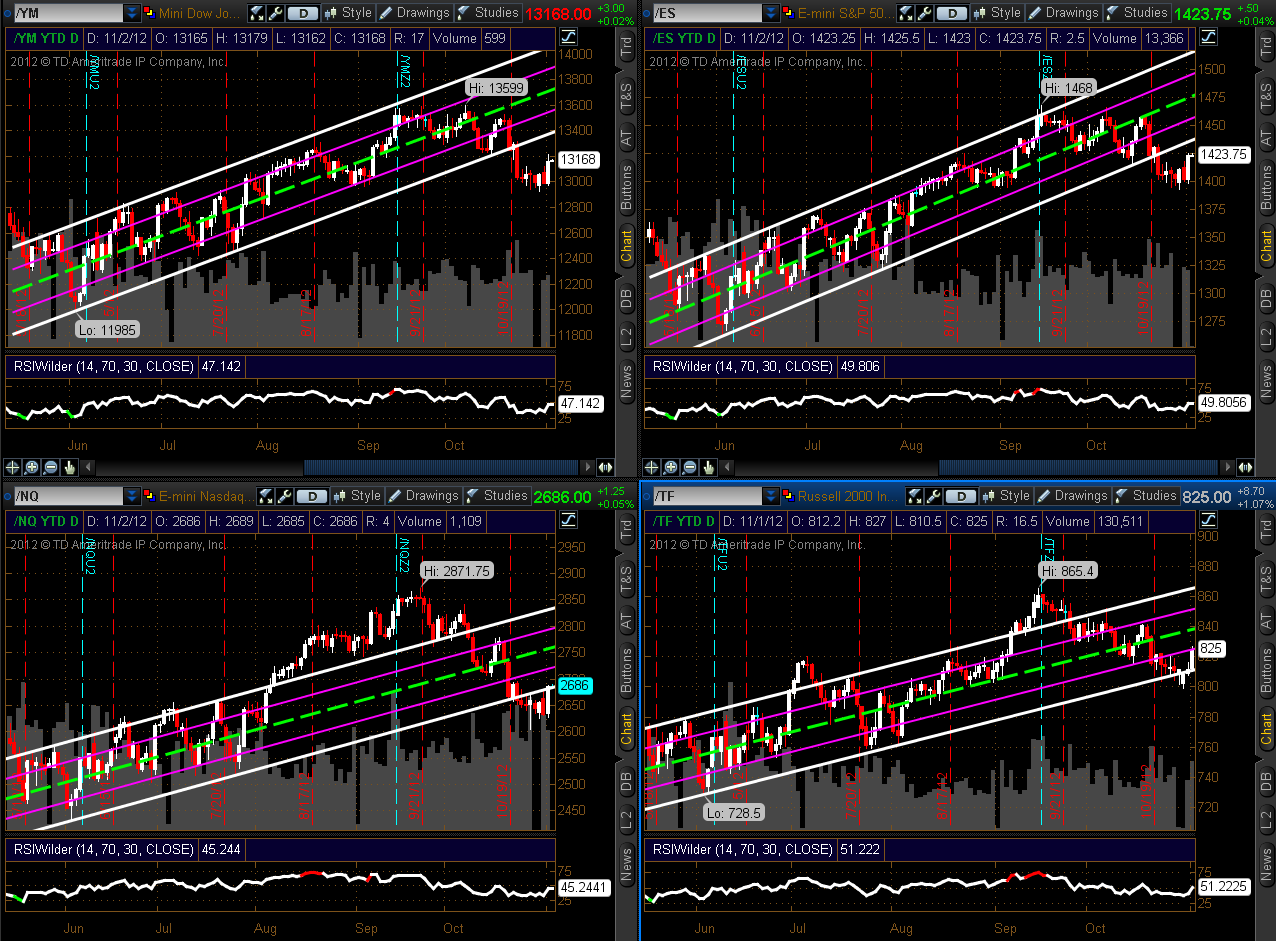
The Daily ratio charts below of the SPX:VIX, RUT:RVX, and NDX:VXN (which compare the Indices to their Volatility Indices) show a bounce to and close just above near-term resistance today. Their Momentum Indicator remains well below zero and, therefore, the Indices remain subject to further bearish influences, particularly if they fall below these resistance-now-turned-support levels.
As with the NQ above, follow through on the buying side from today is now key to any kind of sustained strength in these indices...otherwise, this seems to be the point at which serious selling will likely resume.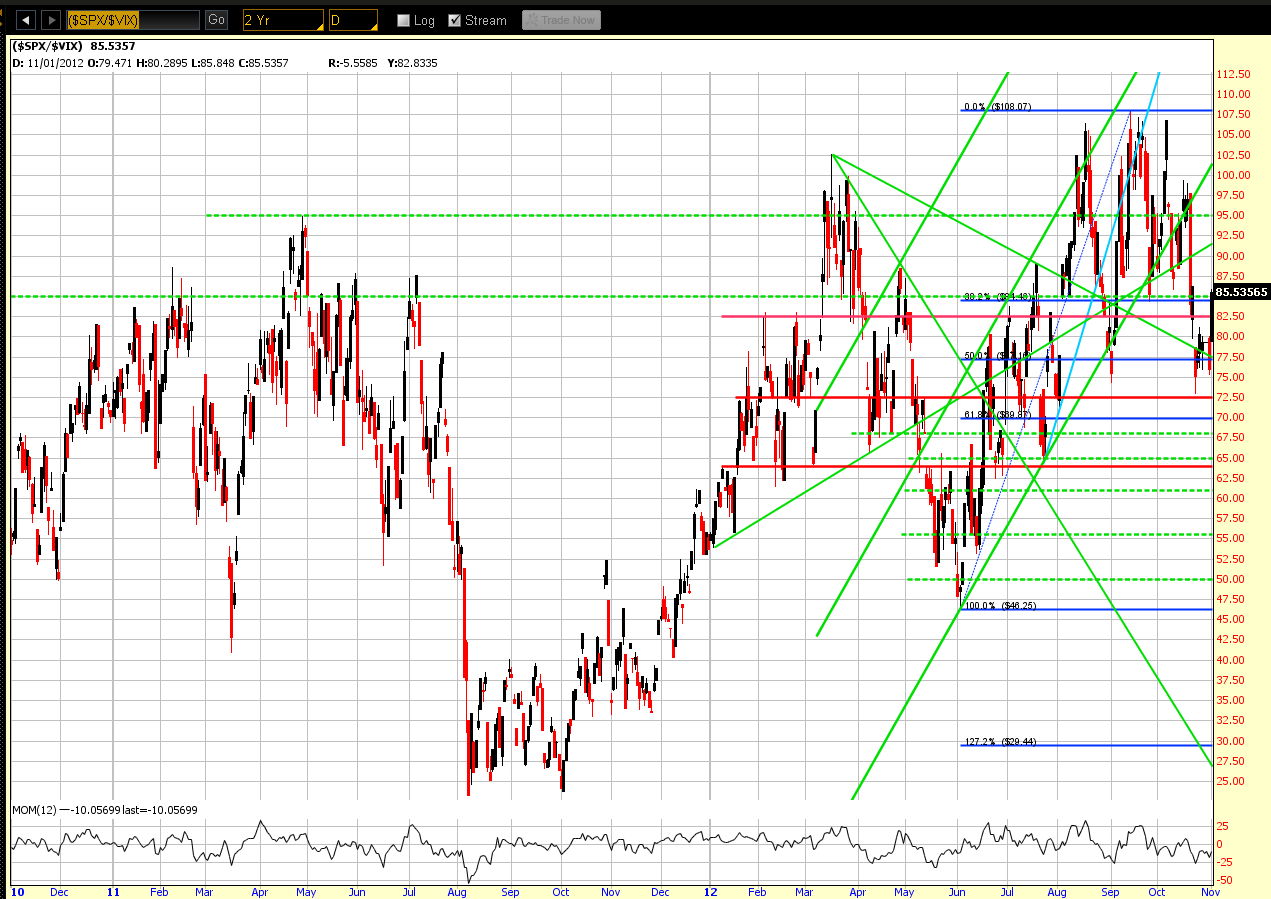
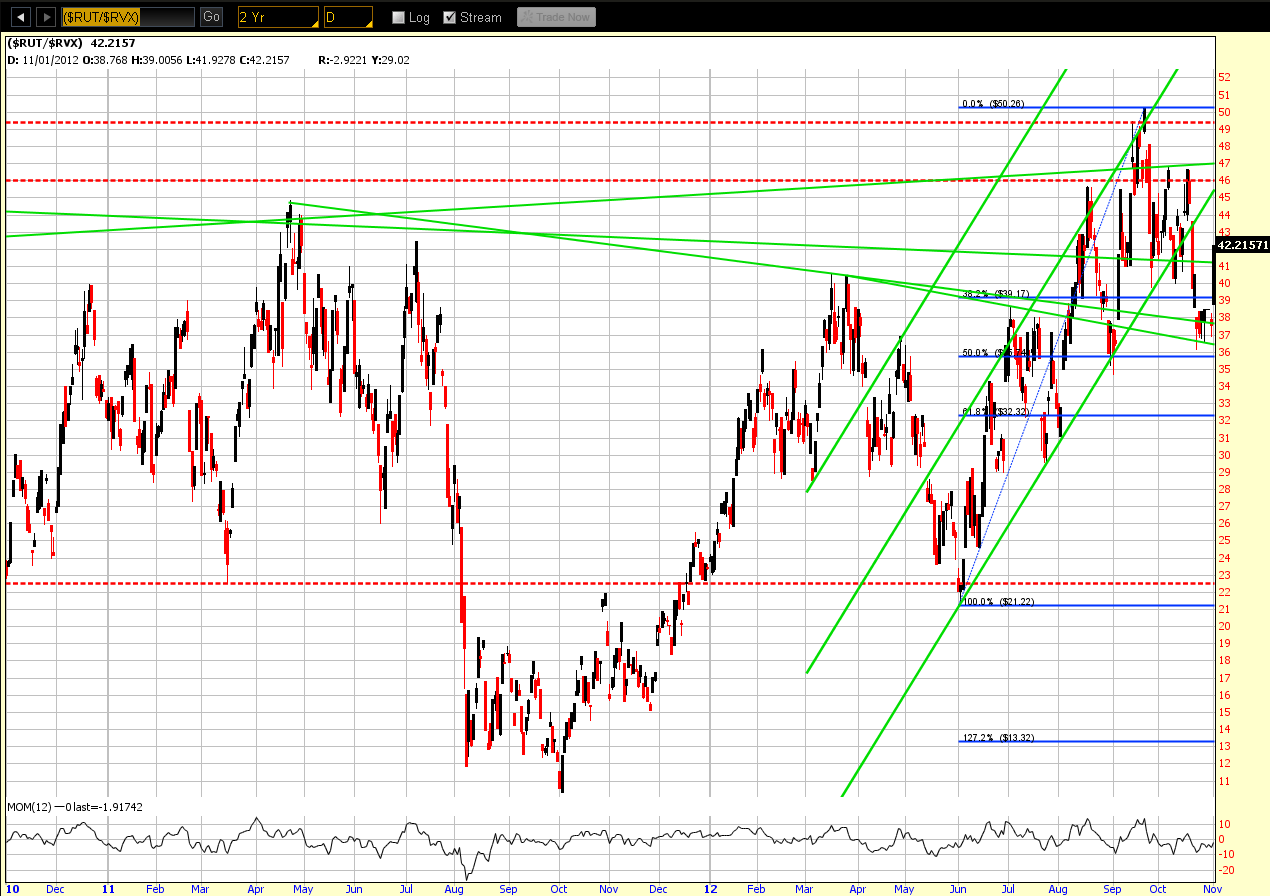
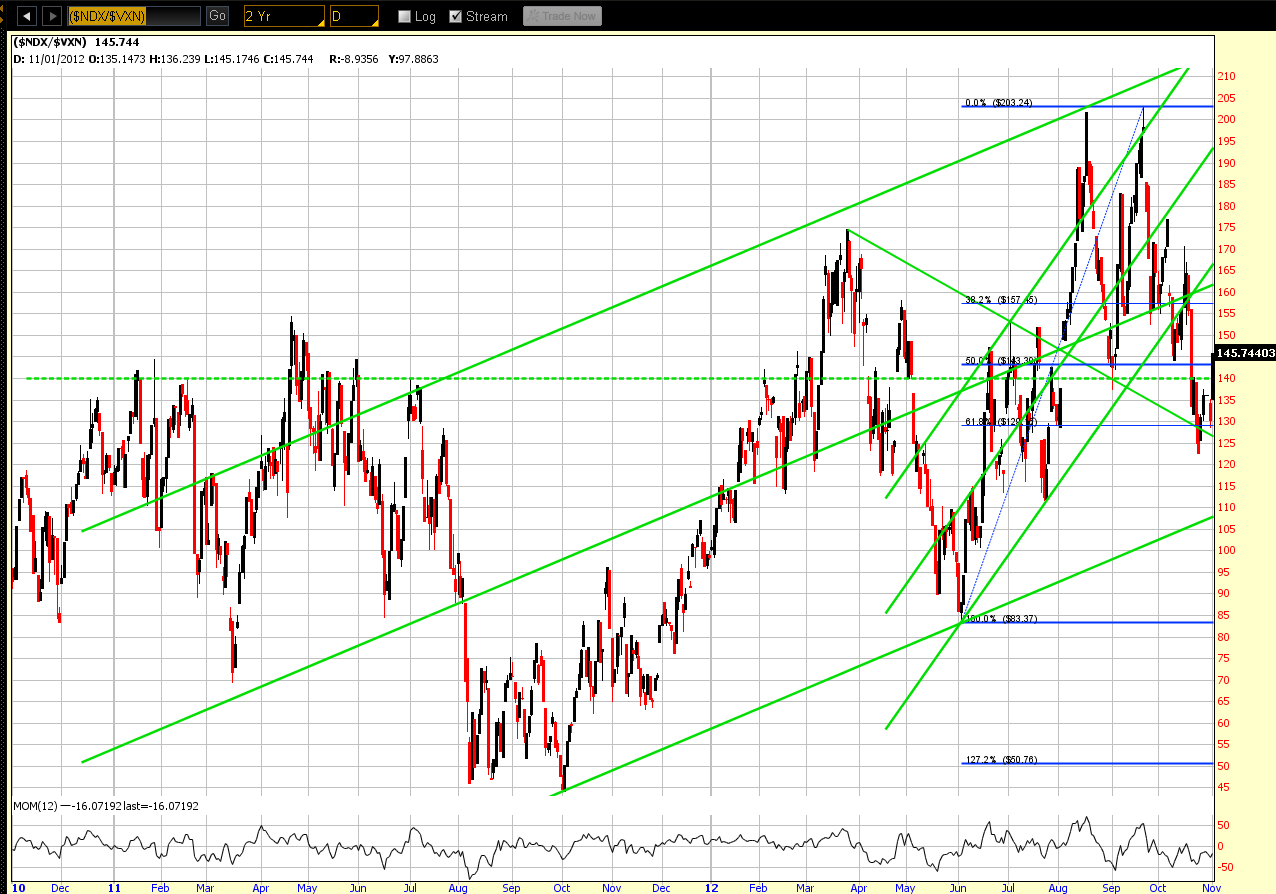
The above RUT:RVX chart is confirming the TF's leadership on the recent bounce and is the one to watch for either continued strength or a resumption of weakness. This may be tracked more clearly on the Daily comparison chart below of the Dow 30, S&P 500, Nasdaq 100, and Russell 2000 Indices. At the moment, the Nasdaq is lagging and the Russell is leading. You can find a link to this chart here.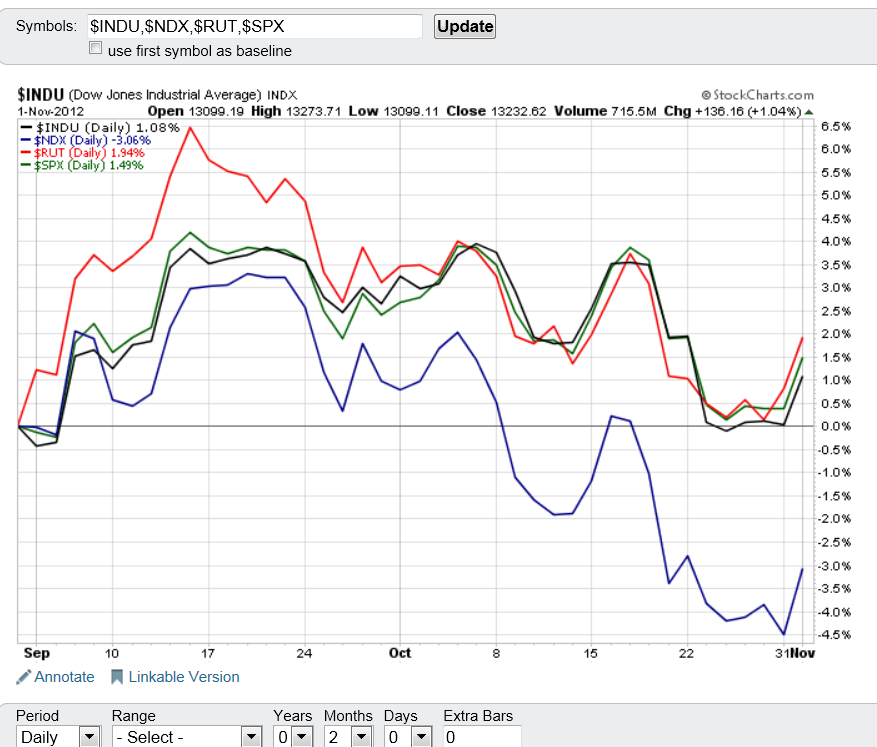
I'll also be keeping a close watch on AAPL, as I discussed in my October 23 post. AAPL is still showing relative weakness compared with the Nasdaq 100 Index (NDX), as shown below on the Daily ratio chart of AAPL:NDX. The Momentum Indicator remains well below zero and continues to decline, which suggests that further weakness is in store for AAPL.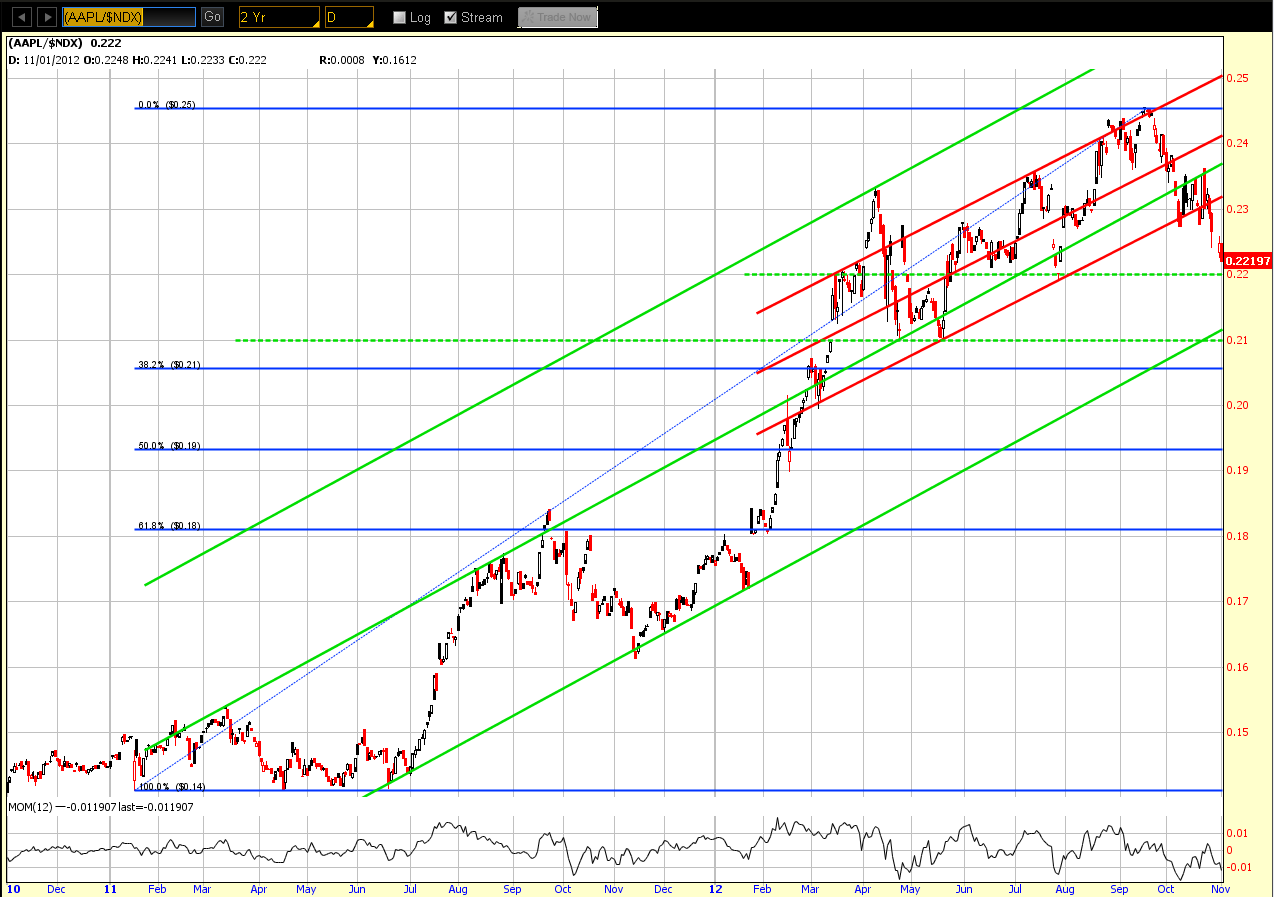
Which stock should you buy in your very next trade?
With valuations skyrocketing in 2024, many investors are uneasy putting more money into stocks. Unsure where to invest next? Get access to our proven portfolios and discover high-potential opportunities.
In 2024 alone, ProPicks AI identified 2 stocks that surged over 150%, 4 additional stocks that leaped over 30%, and 3 more that climbed over 25%. That's an impressive track record.
With portfolios tailored for Dow stocks, S&P stocks, Tech stocks, and Mid Cap stocks, you can explore various wealth-building strategies.
