President Has Not Budged
The financial markets have been treading water for weeks hoping the political process will bear something resembling fruit. Monday stayed on the “little in the way of progress” script. From Reuters:
The White House on Monday reiterated that President Barack Obama would not negotiate with Republicans over the threat of a debt default, sticking to its line as stock prices fell and a government shutdown moved into its second week.
Republicans Shift Focus
While continuing with the “we have to get something” approach, the Grand Old Party has shifted from Obamacare to a conversation about swelling deficits. From Bloomberg:
House Speaker John Boehner said Obama needs to start a conversation about the drivers of the country’s debt — entitlement programs such as Medicare and Social Security — before he could pass a measure increasing the debt ceiling.
Indecisive Markets
With little movement from either side in Washington, the markets have drifted into an understandably indecisive state. This week’s video shows what we’ll be watching as the October 17 debt ceiling deadline approaches.
Investment Implications
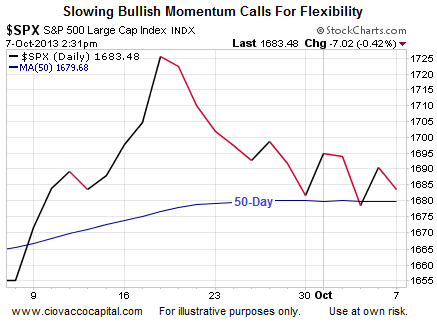
When markets are indecisive and dependent on political outcomes, it is helpful to draw some lines in the sand as risk management reference points. Traders use the 50-day moving average to monitor the health of the market’s intermediate-term trend. In the chart below, the S&P 500’s 50-day is flat, which shows the battle between bullish economic conviction and bearish economic conviction has been fairly evenly matched over the past several weeks. We would be more apt to hold our current positions and add to them if:
- The S&P 500 remains above its 50-day or 1679.
- The slope of the 50-day turns back up.

Support Not Far Below
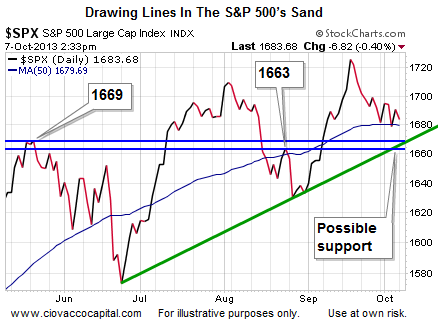
If the posturing continues in our nation’s capital, the green trendline below may attract buyers.
Padding Money Market Balances
We have raised cash several times in the past two weeks to reduce portfolio risk, which tells you something about the observable deterioration that has occurred in the market’s pricing mechanism. If the S&P fails to hold 1669-1679, our market model will call for further shifts toward the conservative side of the asset allocation ledger. While the margin between stocks and fixed income is narrowing, the market is not yet suggesting it is time to swap our stocks (VTI) for bonds (IEF) or inverse stock (SH) ETFs. We will keep an open mind and make further adjustments as the political process continues.
After you click play, use the button in the lower-right corner of the video player to view in full-screen mode. Hit Esc to exit full-screen mode.
Which stock should you buy in your very next trade?
With valuations skyrocketing in 2024, many investors are uneasy putting more money into stocks. Unsure where to invest next? Get access to our proven portfolios and discover high-potential opportunities.
In 2024 alone, ProPicks AI identified 2 stocks that surged over 150%, 4 additional stocks that leaped over 30%, and 3 more that climbed over 25%. That's an impressive track record.
With portfolios tailored for Dow stocks, S&P stocks, Tech stocks, and Mid Cap stocks, you can explore various wealth-building strategies.
