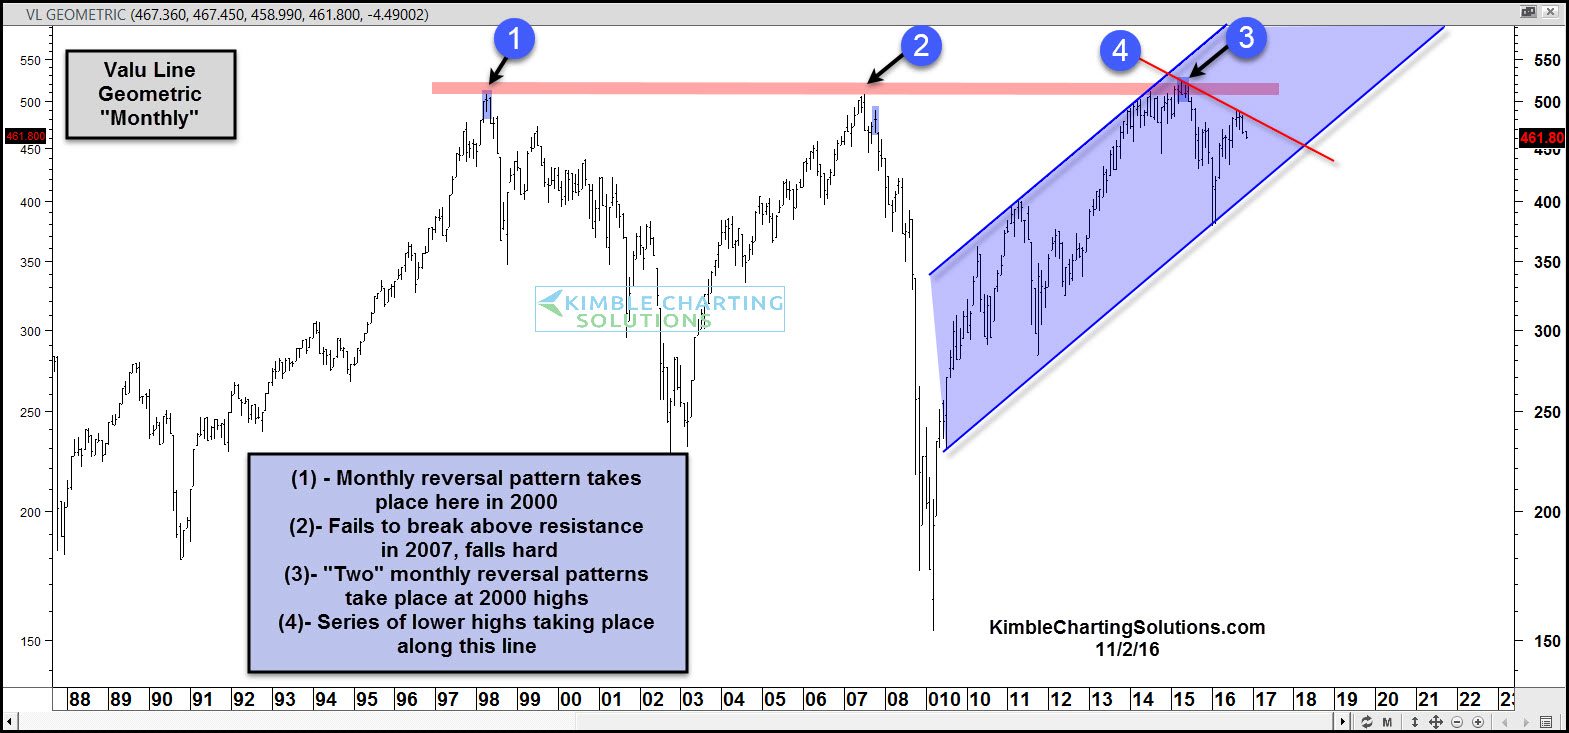
Below looks at the Valu-Line Geometric Index, on a “monthly basis,” over the past 28 years. The Value Line Geometric Composite Index is the original index released and launched on June 30, 1961. It is an equally weighted index using a geometric average. Because it is based on a geometric average, the daily change is closest to the median stock-price change.
The index created a “Monthly reversal” pattern at (1) and sellers stepped forward.
The index rallied in 2007, coming up just short of 2000 levels, where selling pressure came forward at (2).
The index rallied back to 2000 and 2007 highs last year, where it created back-to-back monthly reversal patterns at (3). Since creating those monthly reversal patterns, the index has created a series of lower highs, just along line (4).
This index remains inside of a 6-year rising bullish channel, despite the weakness over the past 18 months. If the index would break below this 6-year rising channel, suspect selling pressure would take place.
Which stock should you buy in your very next trade?
With valuations skyrocketing in 2024, many investors are uneasy putting more money into stocks. Unsure where to invest next? Get access to our proven portfolios and discover high-potential opportunities.
In 2024 alone, ProPicks AI identified 2 stocks that surged over 150%, 4 additional stocks that leaped over 30%, and 3 more that climbed over 25%. That's an impressive track record.
With portfolios tailored for Dow stocks, S&P stocks, Tech stocks, and Mid Cap stocks, you can explore various wealth-building strategies.

