Stock market today: S&P 500 ekes out gain as Trump says open to deals on tariffs
Bond troubles could just be starting.
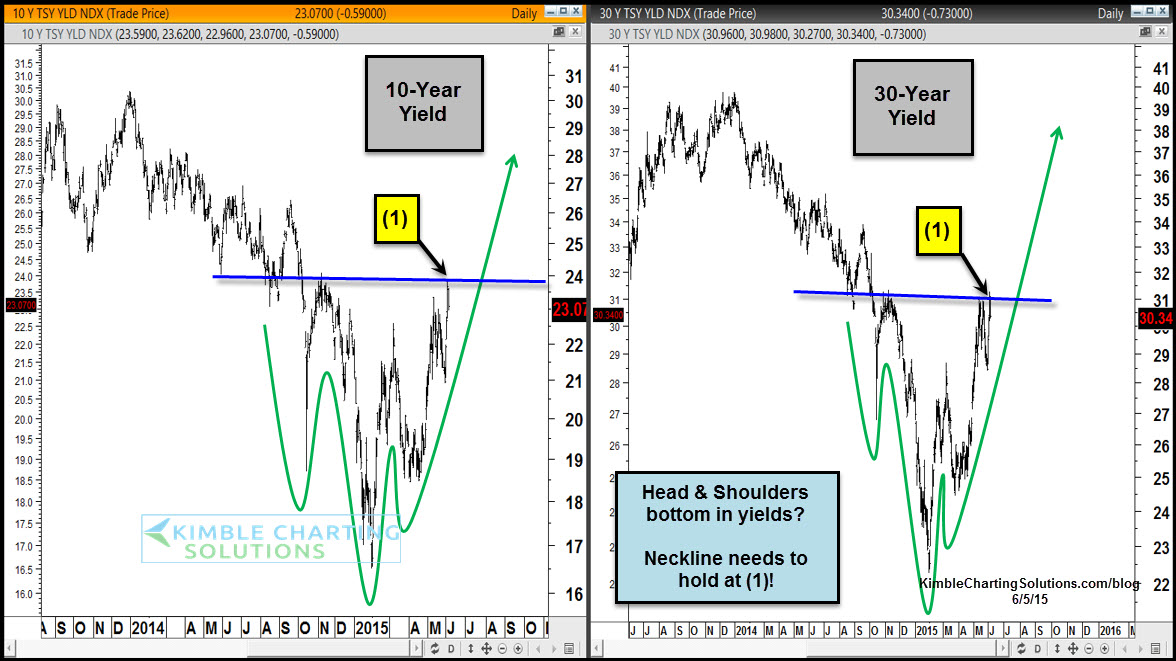
This chart looks at the 10-year and 30-year yields. Each could be making Head & Shoulders bottoming patterns. If this pattern read is correct, each are testing the neckline at (1). A breakout above the neckline could push yields a good deal higher.
From a bond price perspective, what does this pattern look like?
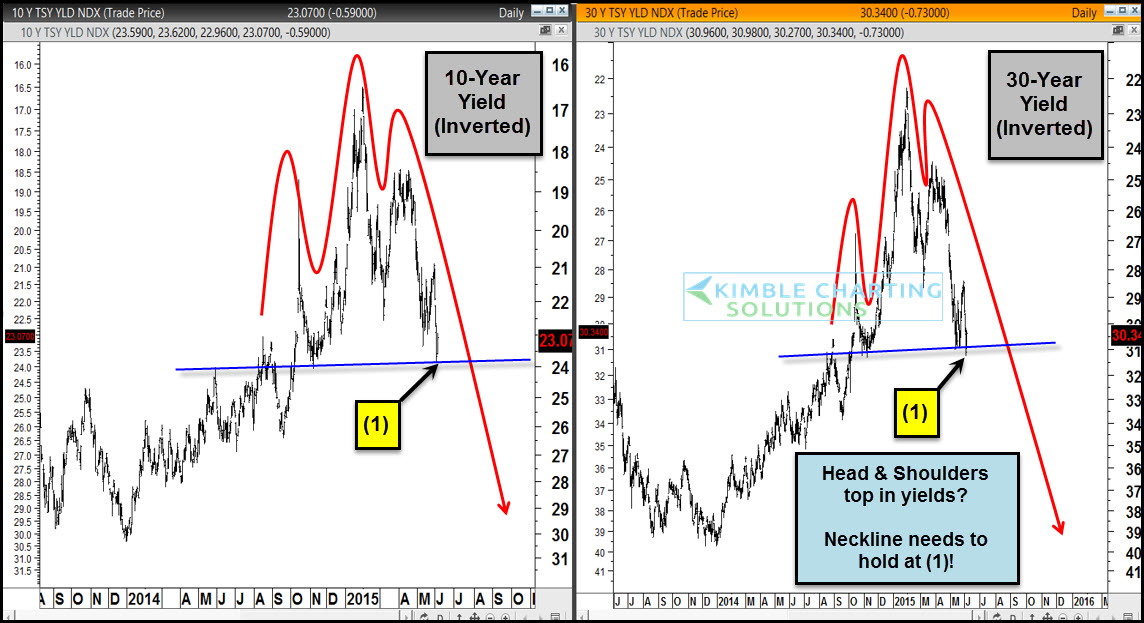
These charts are the 10-year and 30-year yields inverted to look like bond prices. Both appear to have made head and shoulders topping patterns with the neckline being tested right now at (1).
If this pattern read is correct and the neckline gives way, yields move much higher and bonds move much lower.
Which stock should you buy in your very next trade?
AI computing powers are changing the stock market. Investing.com's ProPicks AI includes 6 winning stock portfolios chosen by our advanced AI. In 2024 alone, ProPicks AI identified 2 stocks that surged over 150%, 4 additional stocks that leaped over 30%, and 3 more that climbed over 25%. Which stock will be the next to soar?
Unlock ProPicks AI

