The last time we wrote about Boeing (NYSE:BA) stock was in early October 2018. In that article we shared our view that while BA was approaching the $400 a share mark, it was time for the bulls to play it safe. The Elliott Wave principle suggested that a bearish reversal can soon be expected, even if Boeing stock exceeds $400 first.
It did not. $394 turned out to be the best the bulls were capable of. By December 26th 2018, Boeing was down to $292.50 a share, losing almost 26% in less than three months.
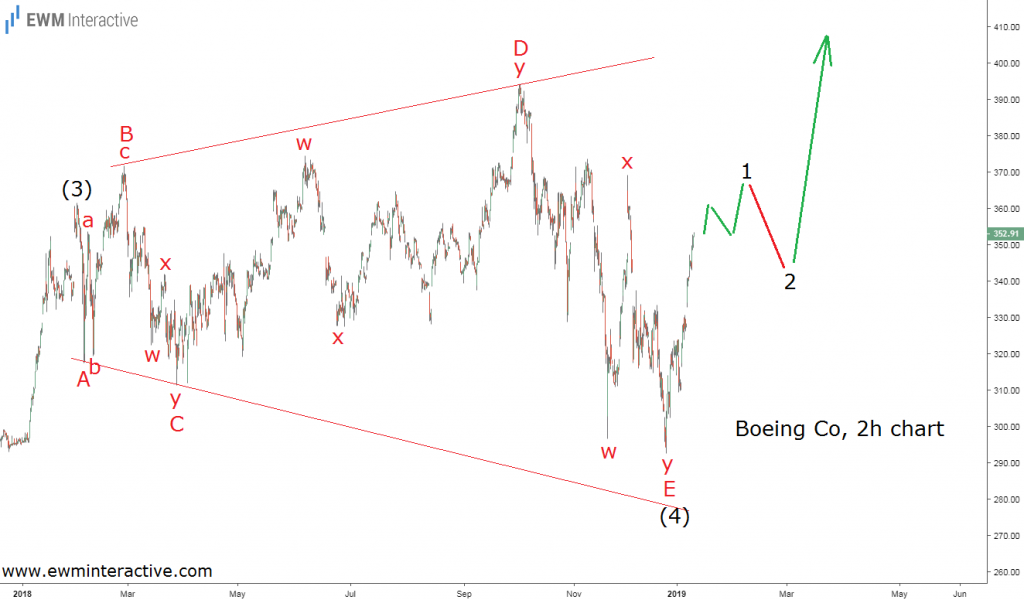
2019 looks much better so far. Boeing stock is once again above $350 and it seems that long-term investors have taken advantage and bought the recent dip. But was that a wise decision? Let’s take a look the updated 2-hour chart of Boeing stock.
It turns out that Boeing has been locked in an expanding triangle correction during most of 2018. Labeled A-B-C-D-E, this pattern has five waves moving sideways, each bigger than the previous one.
A Pattern to Worry About
Triangles are continuation patterns, meaning that once a triangle is over, the larger trend resumes. Since Boeing was undoubtedly in an uptrend before the triangle began in February 2018, it makes sense to expect more strength towards a new all-time high now.
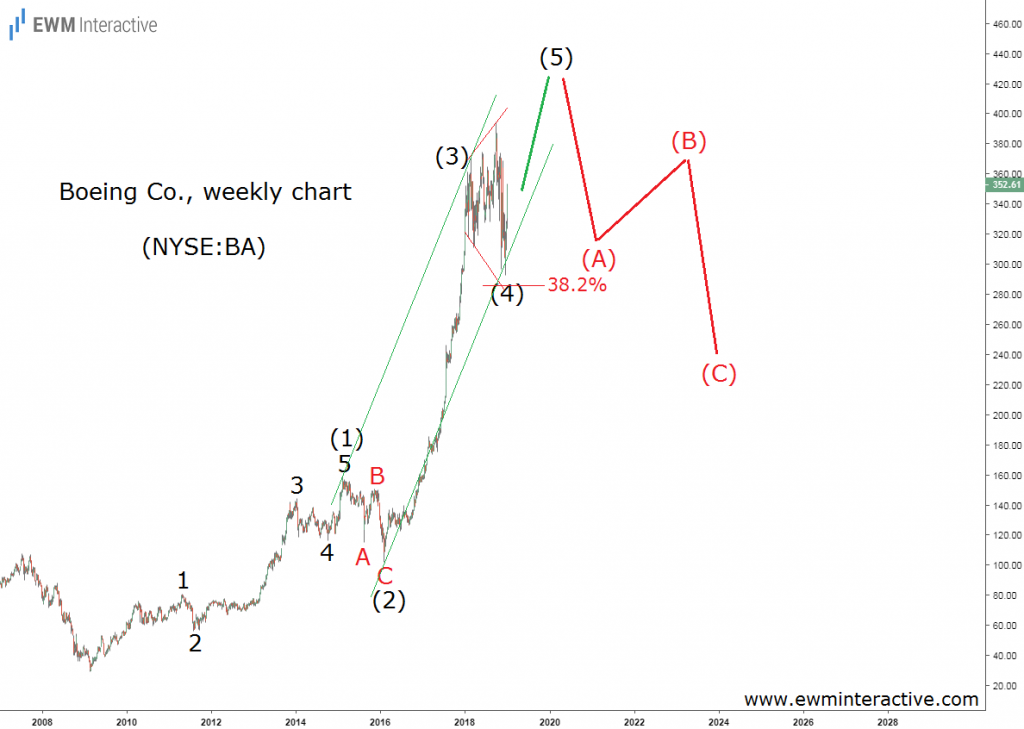
On the other hand, triangles precede the last wave of the larger sequence. Here, this triangle fits into the position of wave (4) on the weekly chart below.
The weekly chart reveals Boeing’s entire uptrend since March 2009. Unfortunately for the bulls, it looks like a five-wave impulse, labeled (1)-(2)-(3)-(4)-(5), whose fifth wave is currently under construction.
The market has obeyed the guideline of alternation since wave (2) is a sharp A-B-C zigzag, while wave (4) is a sideways triangle correction. Wave (4) seems to have terminated slightly above the 38.2% Fibonacci level. In addition, a trend channel can be drawn through the highs of waves (1) and (3) and the lows of (2) and (4) to further validate this count.
Boeing Stock Long-Term Vulnerable
If the analysis so far is correct, we can expect more upside in Boeing stock in the next few months. The exact length of wave (5) is hard to measure in advance, but the bulls should be able to conquer $400 and maybe even $450.
Unfortunately, investors, whose hopes extend to even higher levels are up for a disappointment. The Elliott Wave theory states that every impulse is followed by a three-wave correction in the opposite direction. Just like wave (1) was followed by an A-B-C decline in wave (2), the entire uptrend since 2009 should make way for a big (A)-(B)-(C) decline.
In conclusion, those who bought Boeing stock near $300 in December can do well, provided that they don’t overstay their welcome. A bearish reversal near $450 can lead to a decline of 40% or more in the next 2-3 years.


