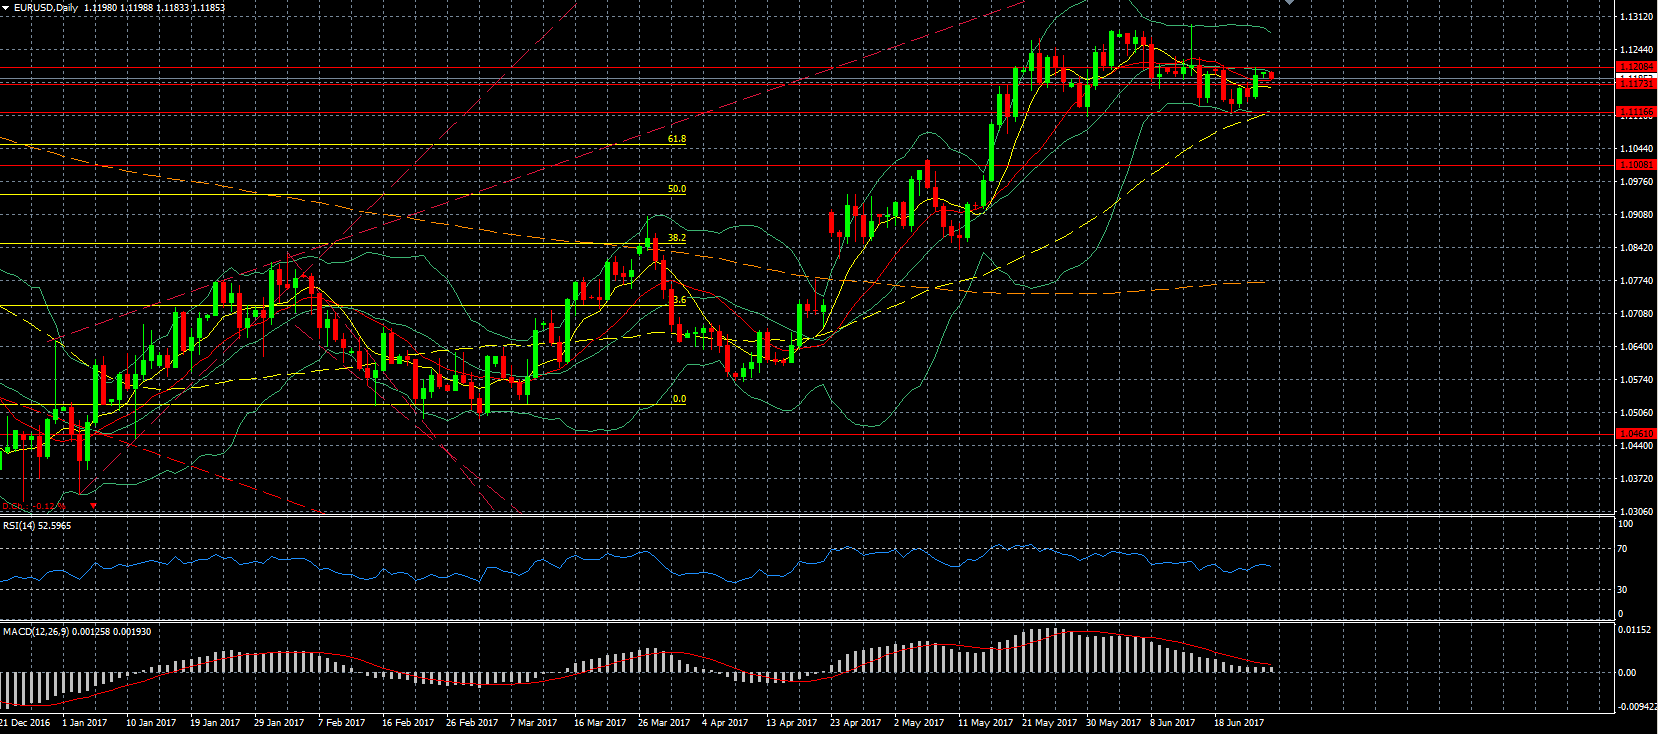
EUR/USD – as we could expect the EUR tested the resistance around the 1.12 but again was not able to base itself above this level as data out of both the Eurozone and the US was more or less mixed. Today we have more data out of Germany, the engine of the Eurozone and later in the day also data out of the US. In addition, we have ECB President Draghi who will be speaking followed tomorrow by FED Chair Yellen.

USD/JPY – remains trading above the 111 level as there hasn’t been enough incentive for the JPY to strengthen, with airbag maker Takata filing for bankruptcy in what is the largest Japanese manufacturer to date filing for bankruptcy.
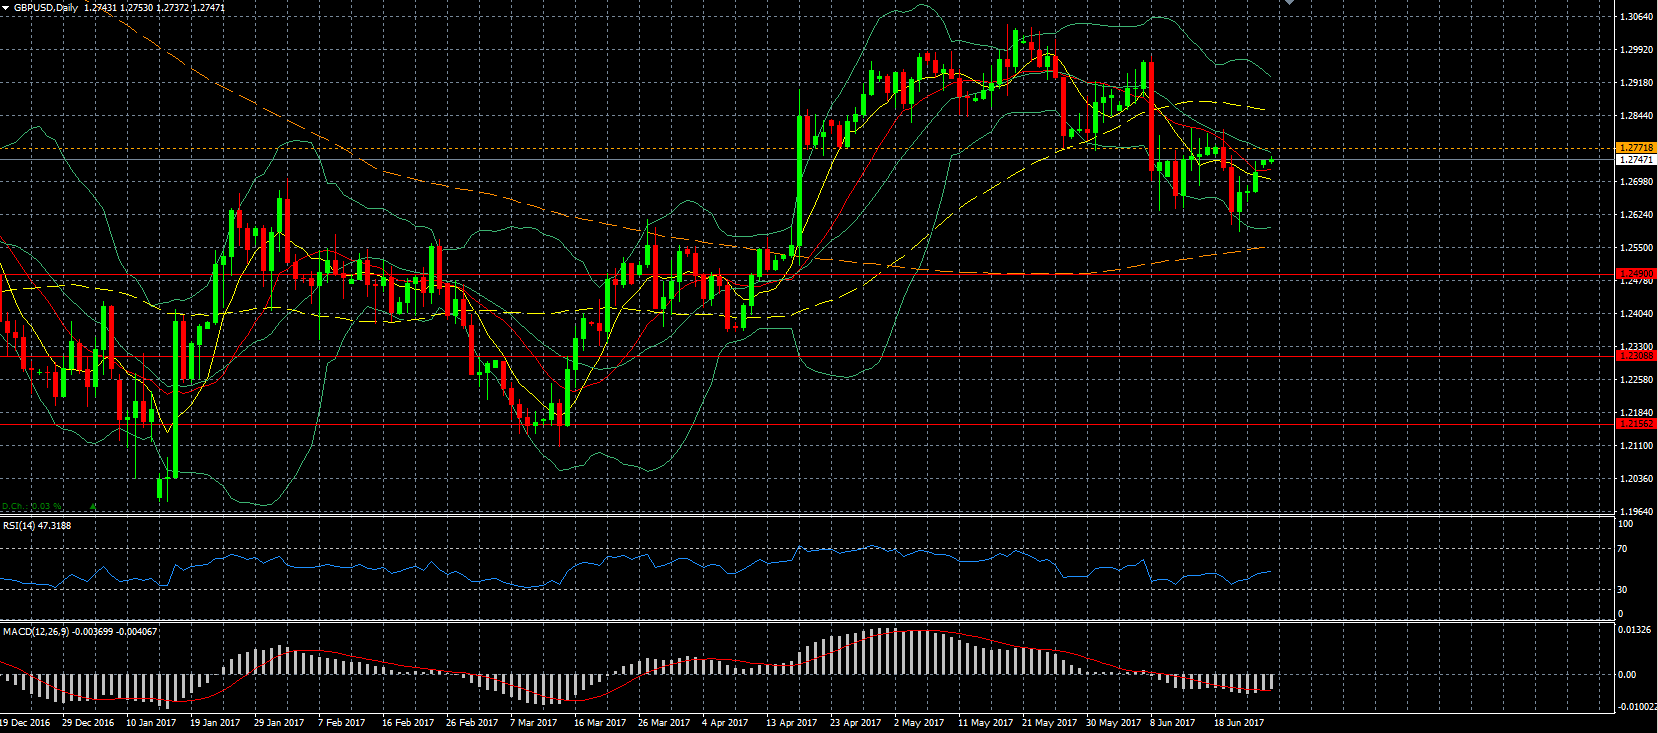
GBP/USD – is getting closer to the resistance around the 1.277 level as the first proposals by PM May with regards to the status of EU citizens living in the UK were not seen as being good enough by EU members. This could signal that the Brexit negotiations could become tough, as this is anticipated to be the area in which an agreement should be the easiest to reach. Another sticking point is who will oversee the agreements, as the EU wants the European Court of Justice to monitor the agreements, while the UK insists that its courts should be the ones monitoring. Nevertheless, the comments from BOE members, except from BOE Governor Carney, signaled that they may raise the interest rate in the coming months, strengthening the GBP.

Indices
Dollar Index – the Bollinger bands are converging and as mentioned on Friday, this usually means that a large move is at hand. This could happen on Thursday if we get a surprise read on the GDP data out of the US, but obviously it can occur before as well.
S&P 500 – remains trading close to its record high as most sectors were in the green with the energy and technology sectors leading the way and the financial and utility sectors the main losers.
XLE (NYSE:XLE) – with oil climbing for a few days in a row, we can see the energy sector following, as we have already established that recently oil is the leading indicator for the index.
Commodities
Cocoa – did not complete the M formation as the commodity sector as a whole was able to recover on Friday.
Gold – was able to prevent a third consecutive weekly drop as the USD dropped due to concerns inflation would prevent further rate hikes, as we will see what the data this week will tell us on the state of the US economy with noticeably the most important data the GDP on Thursday.
Oil – continued to recover from its lows as we are seeing some buying at these low levels on expectation that we have reached a bottom. This happens even though we saw the number of active rigs increase yet again, for the 23rd straight week which indicates that production in the US is unlikely to go down in the near future. What will be interesting to see if we will see yet another decline in inventories, which could have another positive effect on oil prices and also if imports declined further, which could signal that OPEC is trying actively to bring down the inventories in the US to affect the oil price.
Stocks
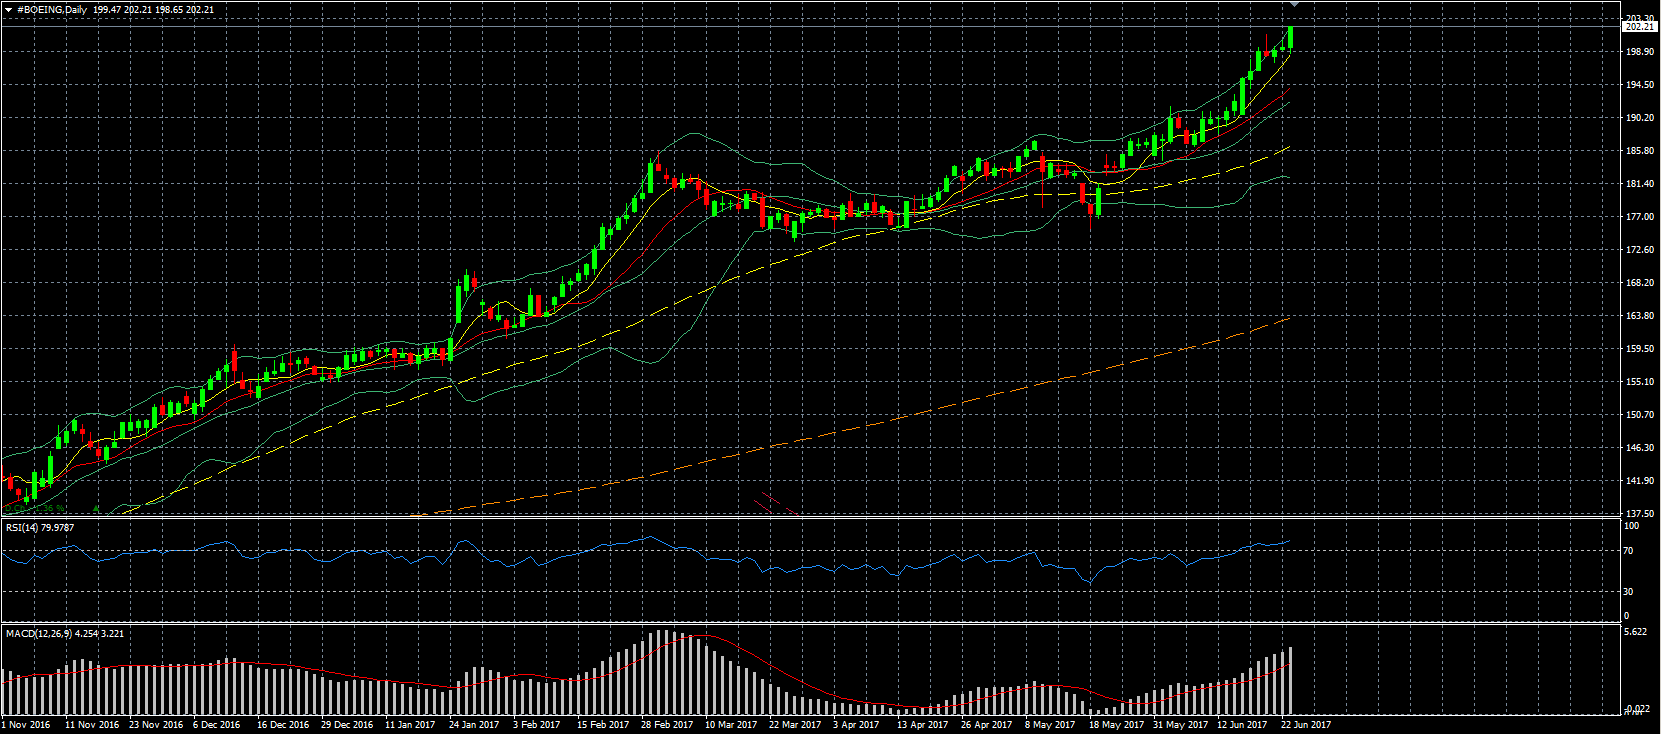
Boeing (NYSE:BA) – closed above the 200 level for the first time in history and reached a new record high as it finished of a successful Paris Air Show with a flurry of orders.

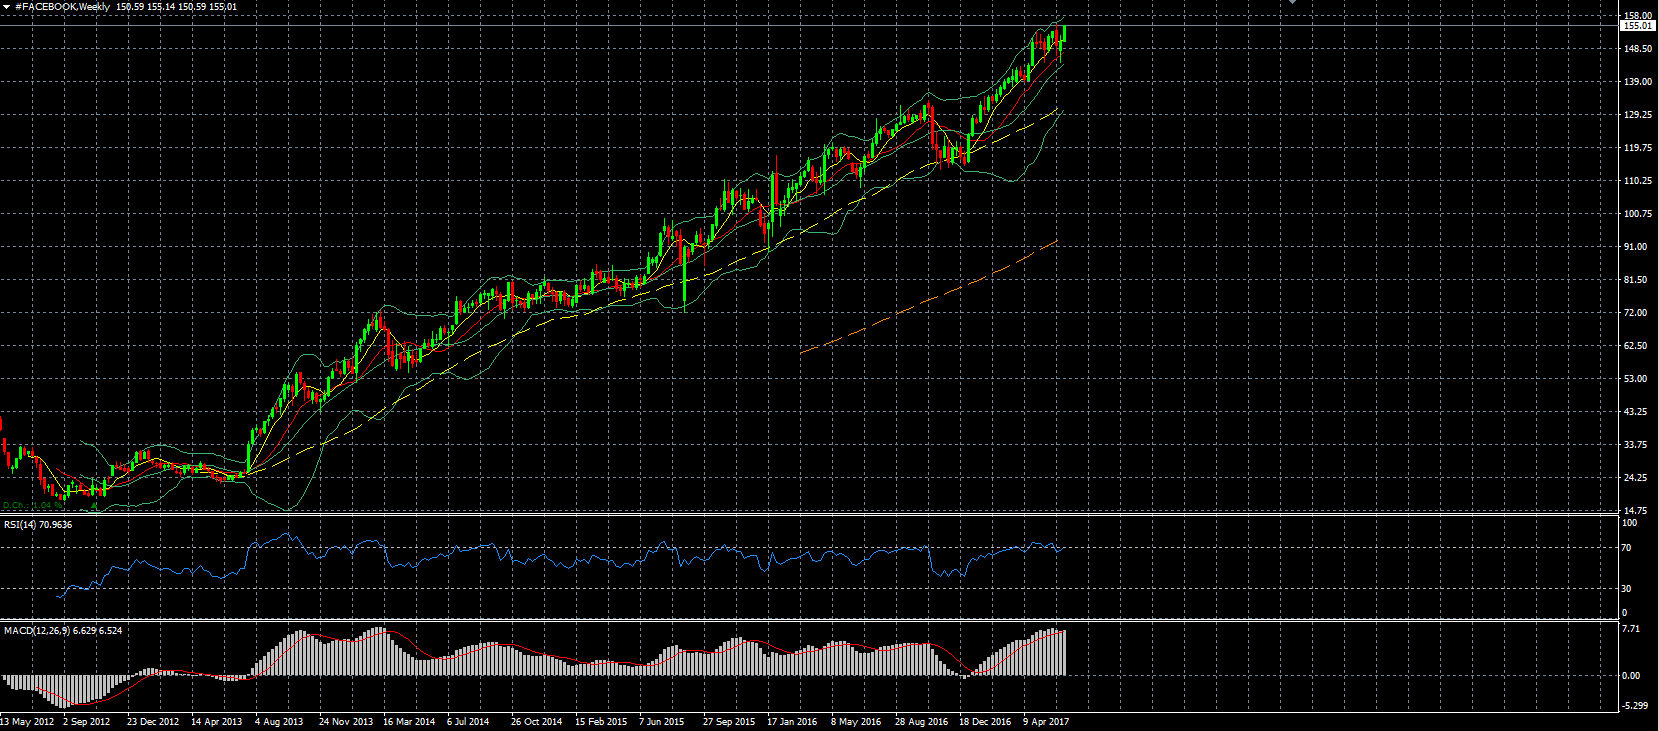
Facebook (NASDAQ:FB) – without too much news, Facebook has been climbing and is now trading very close to it’s all-time high. The skepticism right after its IPO lasted for around a year before it was clear that Facebook was able to adept and actually make revenue, in part due to new acquisitions. The range of 25-35 is long behind us and it is now trading at more than a four-fold.

