The last 30 days did not bring a lot of joy to cryptocurrency traders, to say the least. Bitcoin reached, and on some exchanges even exceeded the $3000 mark on June 12th, but instead of continuing to the north, it fell to as low as $2,120 on June 15th. Nearly a month later, the biggest virtual currency is still unable to rebound, hovering around $2,350 as of this writing. The situation is even worse for Ethereum investors, who saw the price of their tokens plunge by almost 60% from the $420 all-time high.
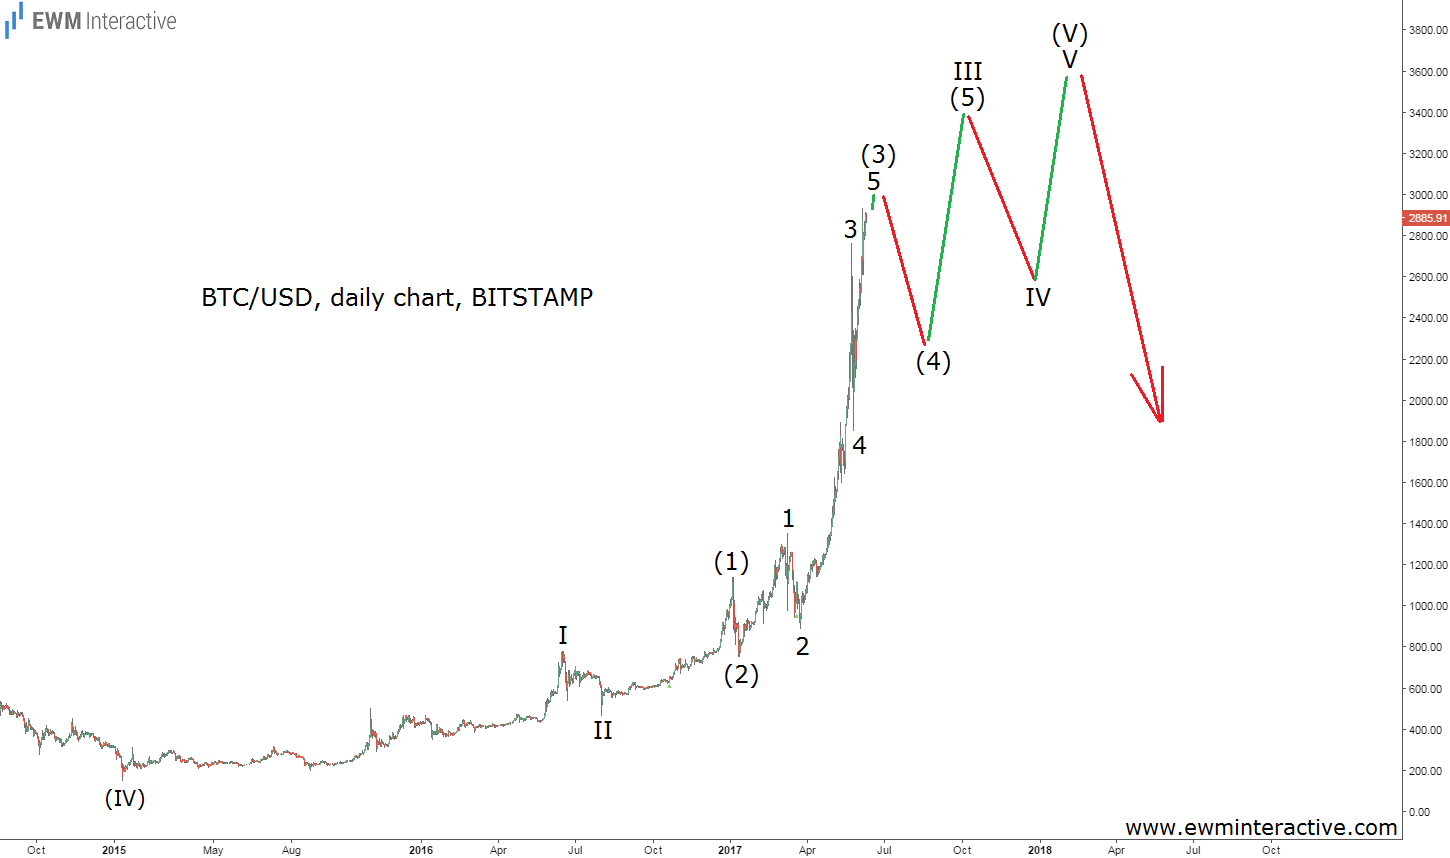
But let’s get back to Bitcoin. On June 11th, one day before BTC/USD reached its all-time high, we published “Bitcoin Bubble: Is It “Different This Time?”, which included the following daily price chart.
As visible, a month ago the Elliott Wave Principle suggested that instead of joining the bulls near $2,900, we should expect a significant plunge in wave (4), before the uptrend could resume in wave (5) of III. Therefore, at least to Elliotticians, the current price slump to $2,120 did not come as a surprise.

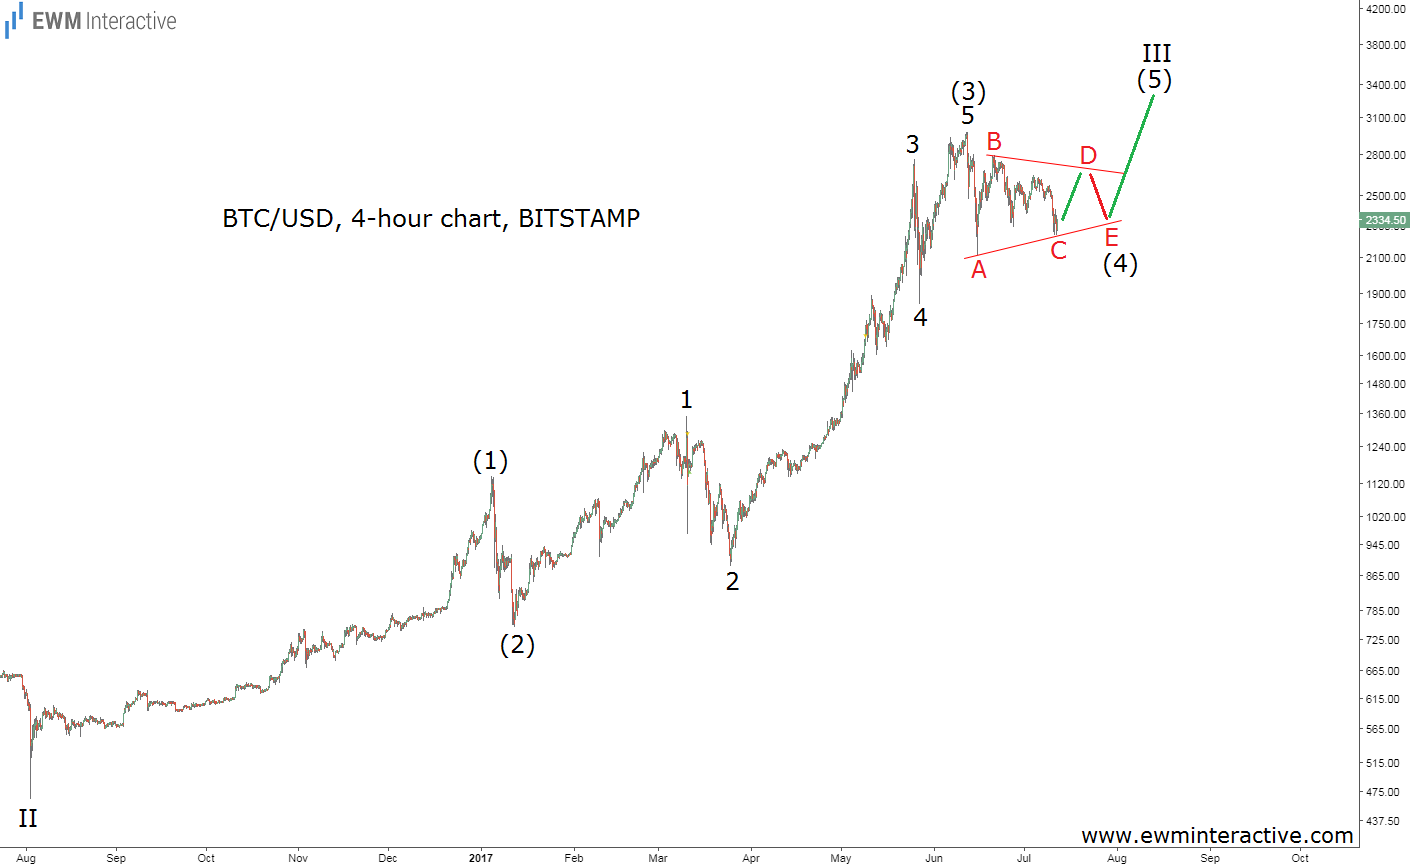
The 4-hour logarithmic chart of Bitcoin shows that the selloff and the following lack of direction fit perfectly in the position of the wave (4) we have been anticipating. In addition, it looks like wave (4) is going to evolve into a triangle, thus obeying the guideline of alternation, which states that if the second wave within an impulse was a sharp correction, the fourth wave is likely going to move sideways.
We still believe there is a crypto bubble under construction right now and the long-term consequences will not be pretty for the involved. In the mid-term, however, it seems Bitcoin should still be able to reach new highs, once wave (4) is over and wave (5) begins. Even if the triangle is ruined and BTC/USD falls to $2000, the uptrend should remain in progress, so do not run for the hills just yet.
