
Bitcoin Technical Analysis for December 11
Since my last week’s technical analysis, Bitcoin declined another 20 percent. In this week’s technical analysis, I want to give an outlook on the current situation of Bitcoin.
XBT/USD DAILY CHART
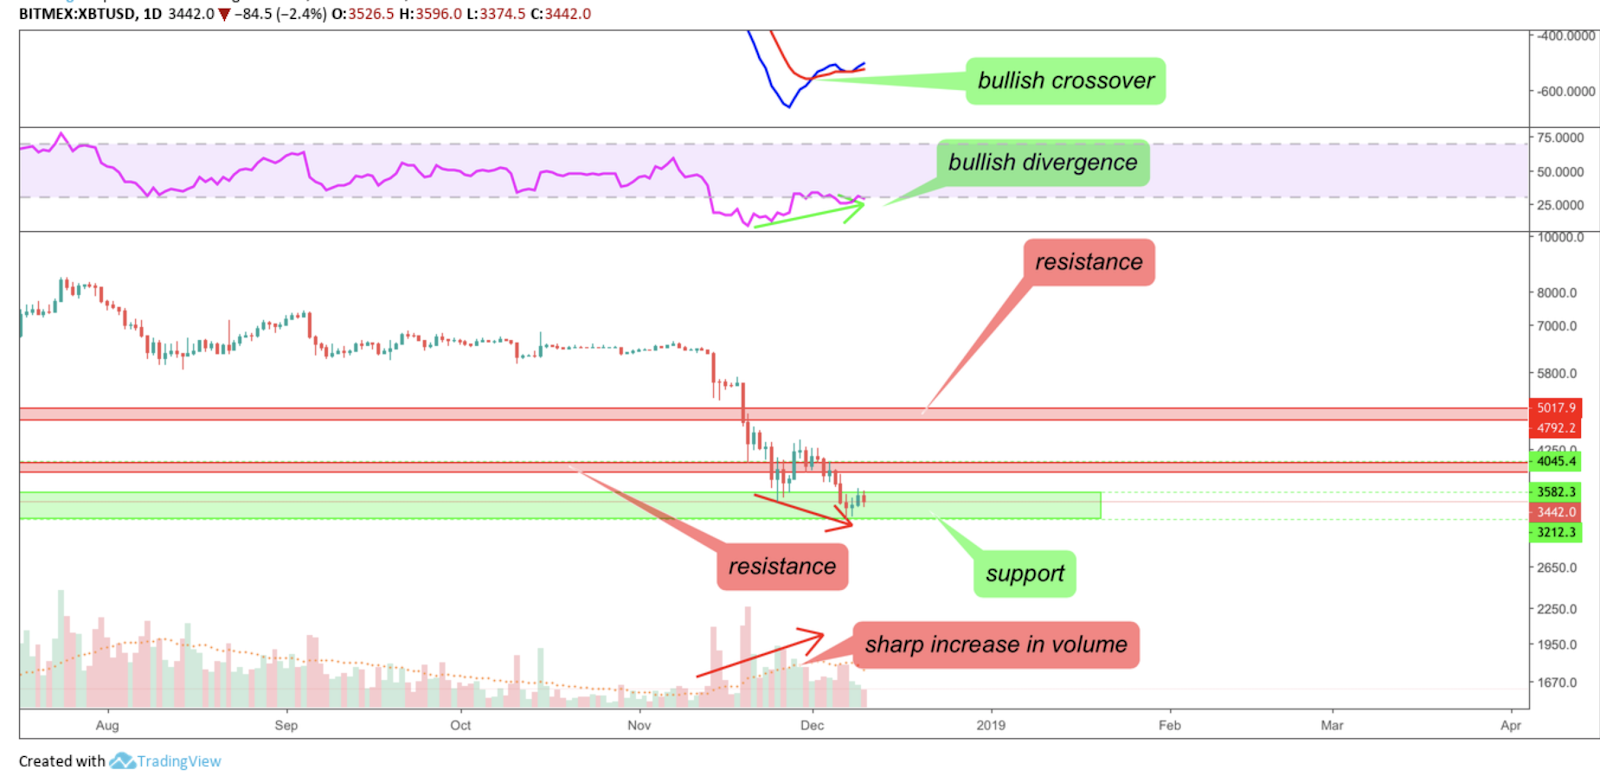
Bitcoin broke the prior support between $3892 and $4050 and went all the way down to the current support where it bounced $420 from $3200 to $3620. Thus, it is still ranging in the support zone between $3200 and $3600 and faces its next resistance between $3892 to $4050. While the support held the first test and succeeded to hold so far, the indicators are more interesting to watch right now. As the Moving Average Convergence Divergence (MACD) not only performed a bullish crossover in a very low region, it also managed to bounce from a potential bearish crossover, indicating further upward movement for the coming days to weeks. Interestingly enough, the Relative Strength Index is performing a series of higher lows in an oversold region while Bitcoin is performing lower lows, indicating strong bullish signs of a short-term trend reversal, making an upward movement to at least the first resistance at $4000 highly likely. Due to the strong sell pressure during the end of November to early December, the sharp increase in volume brought the price down to its current support level. However, if it holds, the bullish divergence of the RSI and the bullish crossover of the MACD are very promising for the short-term outlook of Bitcoin’s price.
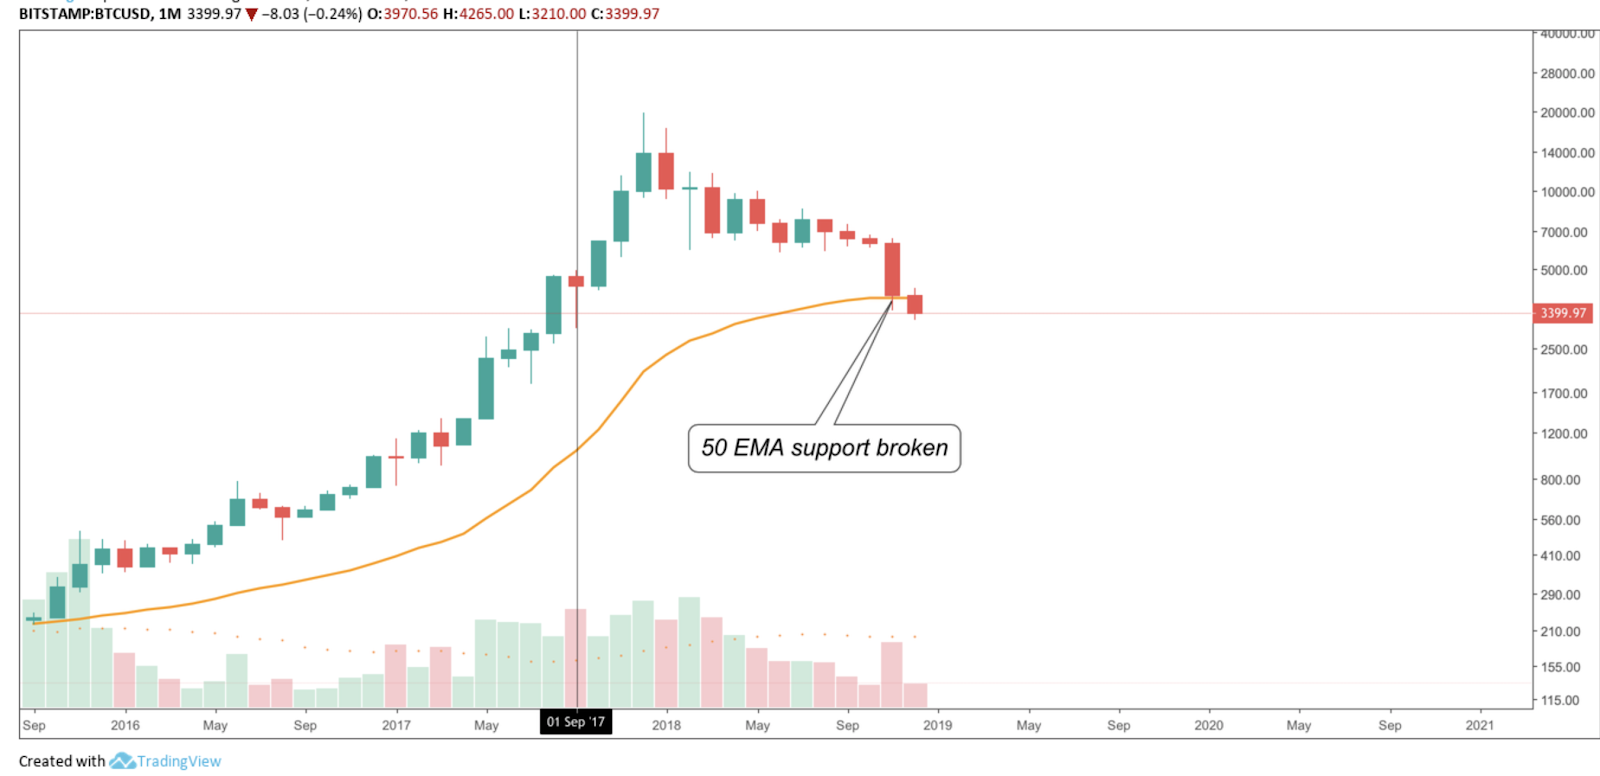
BTC/USD MONTHLY CHART
However, as in the previous technical analysis concluded, the 50-month EMA support is the last chance for a trend-reversal for Bitcoin in the mid-term. Unfortunately, it failed to hold so far and the downtrend for Bitcoin remains intact. This, however, could still change since the monthly candles opened beneath the 50-month EMA, but could close above it, since December has another three Weeks until the next month begins. Thus, the 50-month EMA might successfully act as a support, although it failed to do so so far.
While it is not clear how long the bear-trend for Bitcoin will last, the target of a potential bottom remains under the $3000 mark. Bitcoin will most likely decline another 30 to 40 percent until a trend reversal might take place.
To conclude, Bitcoin has still plenty of room to continue its downtrend, at least from a technical point of view. Experts on the field like Max Zmitrovich, a security token expert and the co-founder and CEO of the Swiss-registered financial services company Azbit AG, commented on the situation, “We are moving away from the wilder practices of the past couple of years, when one could buy dubious ‘utility’ tokens at an ICO and then sell them as soon as they got listed on an exchange, earning a profit of over 100%. With the current bear market, many projects fail before even reaching an exchange, and backers have become much more cautious and demanding – they want more than just a ‘revolutionary idea.’ They want stability and guarantees – and it is something that equity can provide.”