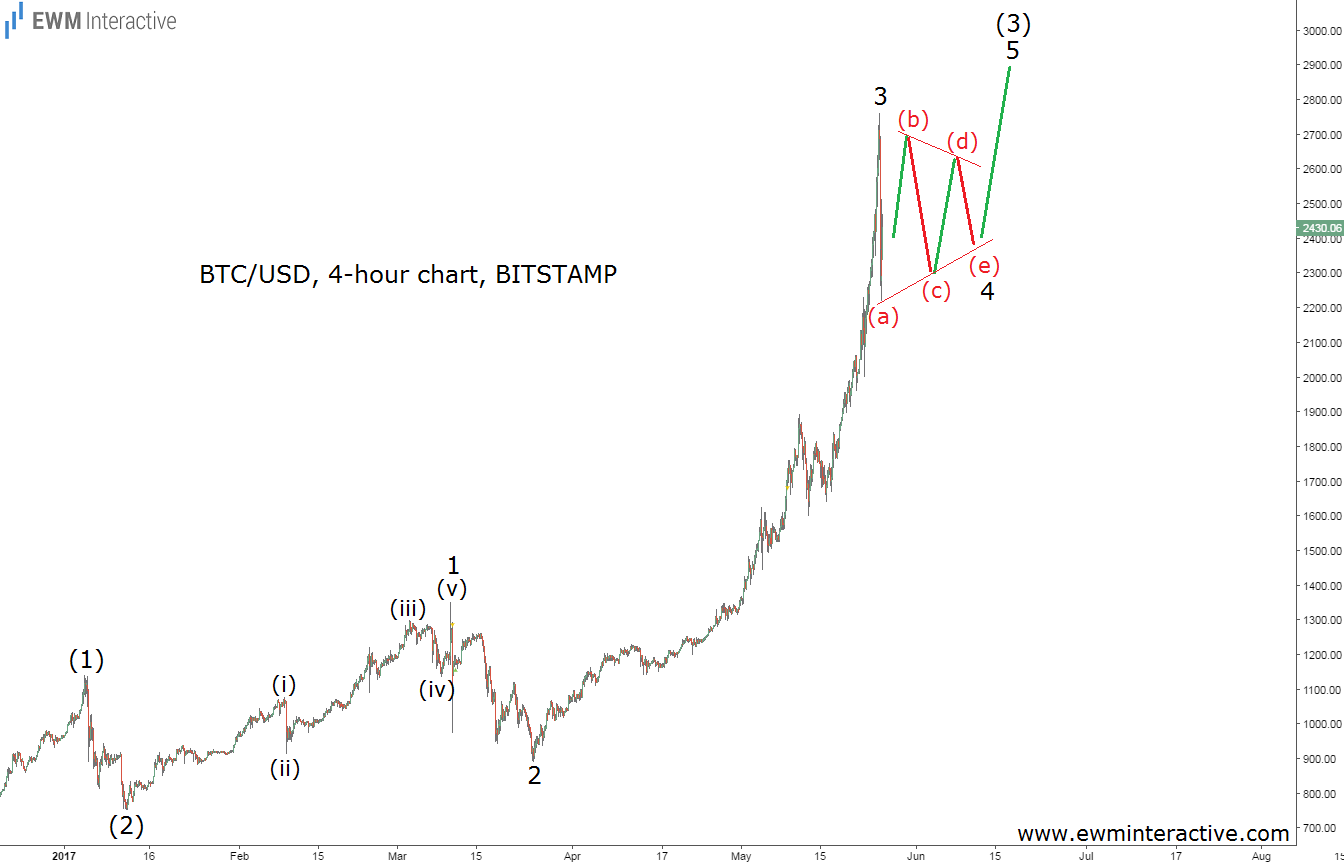
If the market was a human being, every psychiatrist would easily be able to diagnose it with bipolar disorder, but when it comes to Bitcoin, it is nothing short of schizophrenia. The market capitalization of the cryptocurrency more than doubled in less than a month, after its price climbed from $1348 at the start of May to as high as $2760 as of yesterday. At one point on Thursday, Bitcoin was up more than $320 or over 13% for the day. Then, almost in the blink of an eye, it crashed by over $500 in under 2 hours.
Truth is, the crypto community can hardly be more polarized. While some say that Bitcoin is the future and the uptrend is just getting started, others believe we are witnessing a bubble similar to the tulip mania in the 17th century. Time will tell. Fortunately, the Elliott Wave Principle can help us reduce the influence of emotions and extract some information directly from the market through the price charts, to guide us, at least in the shorter term.
The 4-hour chart above shows Bitcoin’s so far phenomenal 2017. The virtual currency initially fell to $751 in January, but then recovered in impulsive fashion to a new all-time high of $1350 two months later. Then, the SEC’s rejection of the first Bitcoin ETF coincided with another correction in wave 2, when the bears dragged prices below the $900 mark. And just when doubts started creeping in, the most powerful phase of every impulse, wave 3 of (3) to the north, began. It was a wonder to behold, traveling all the way up from $891 to $2760.
Still, even the strongest of trends are interrupted by a correction from time to time. In Bitcoin’s case, it appears that yesterday’s sharp plunge from $2760 to $2221 fits in the position of wave 4 of (3). This means that Bitcoin’s uptrend is still in progress and the price of the asset should continue to the north in a series of fourth and fifth waves for a while. If this is the correct count, $3000 is still there for the taking.
Nevertheless, we should keep the guideline of alternation in mind. It says that within an impulse, the two corrective waves – 2 and 4 – tend to differ from one another. Since wave 2 was a sharp decline, wave 4 would probably evolve into a sideways correction, a triangle, for example. This suggests yesterday’s slump is just wave (a) of wave 4, which still needs to build waves (b), (c), (d) and (e), before the bulls officially return. Until then, the price of Bitcoin is likely to remain in a range between $2800 and $2200. Anyway, it has been a long way since “Bitcoin Hiding an Ace in the Sleeve”.
Which stock should you buy in your very next trade?
AI computing powers are changing the stock market. Investing.com's ProPicks AI includes 6 winning stock portfolios chosen by our advanced AI. In 2024 alone, ProPicks AI identified 2 stocks that surged over 150%, 4 additional stocks that leaped over 30%, and 3 more that climbed over 25%. Which stock will be the next to soar?
Unlock ProPicks AI