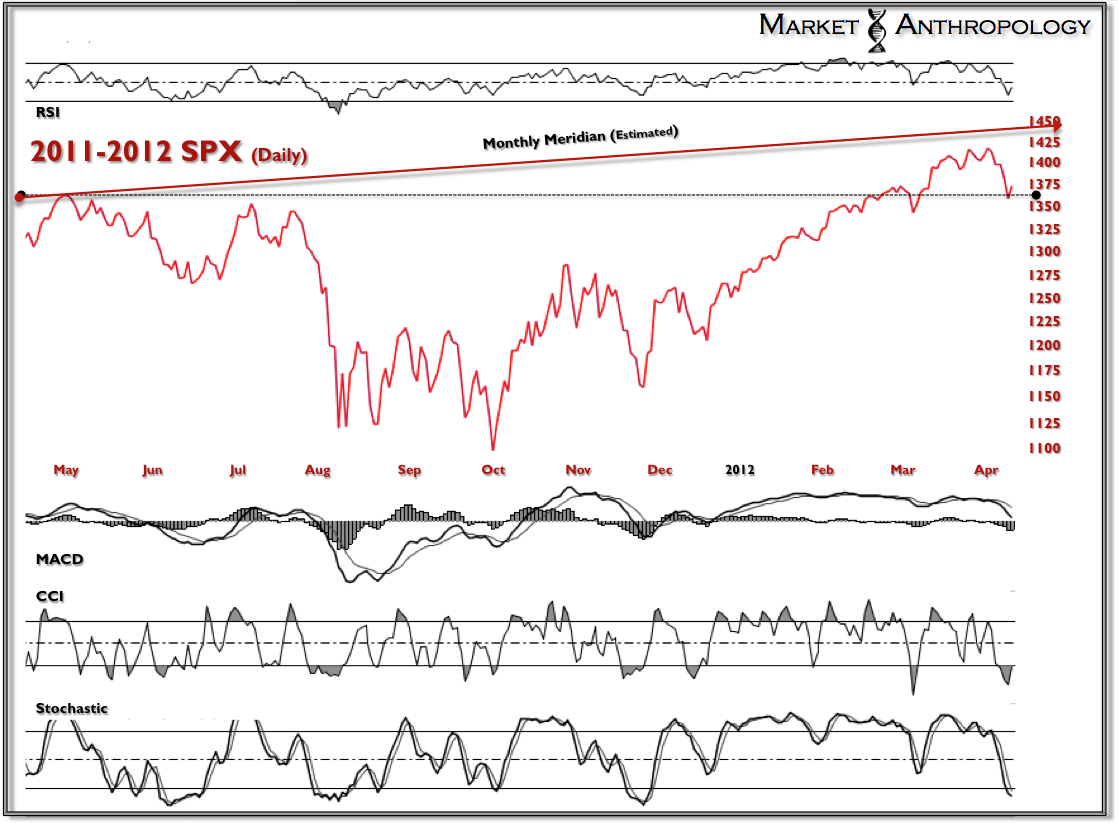
Recently I have been contrasting the structures of various indexes from the 1994/1995 timeframe to the current market. What initially drew me to the comparison was my work with the Meridian charts that I developed last year. And while the economy today is in a much weaker structural predicament than the 1990's, the unparalleled deployment of monetary stimulus across the globe is masking much of that fragility - and eliciting a very similar structured (charts) equity market recovery.
In light of this past weeks rapid decline, I find it noteworthy that the SPX also retested the initial 100% retracement breakout in March of 1995.
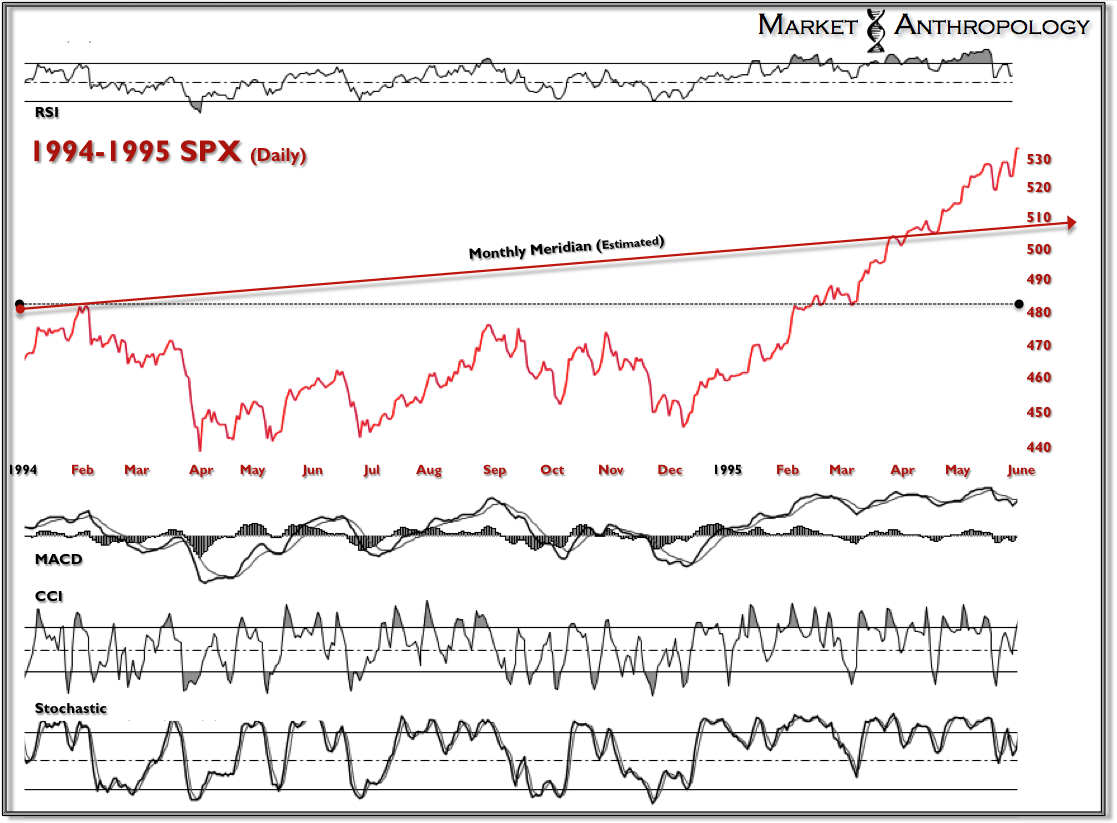
Should the breakout region around 1364 (daily) and today's recovery hold, I suspect the market will rapidly make its way back to the Meridian once again. As in 1994-1995, the market was initially rejected a year before it broke through and ushered in the uber-bull we now know as Irrational Exuberance. I find it interesting that there is a critical technical and fundamental (earnings season) window for the market to react in. In essence, it should be a binary outcome.
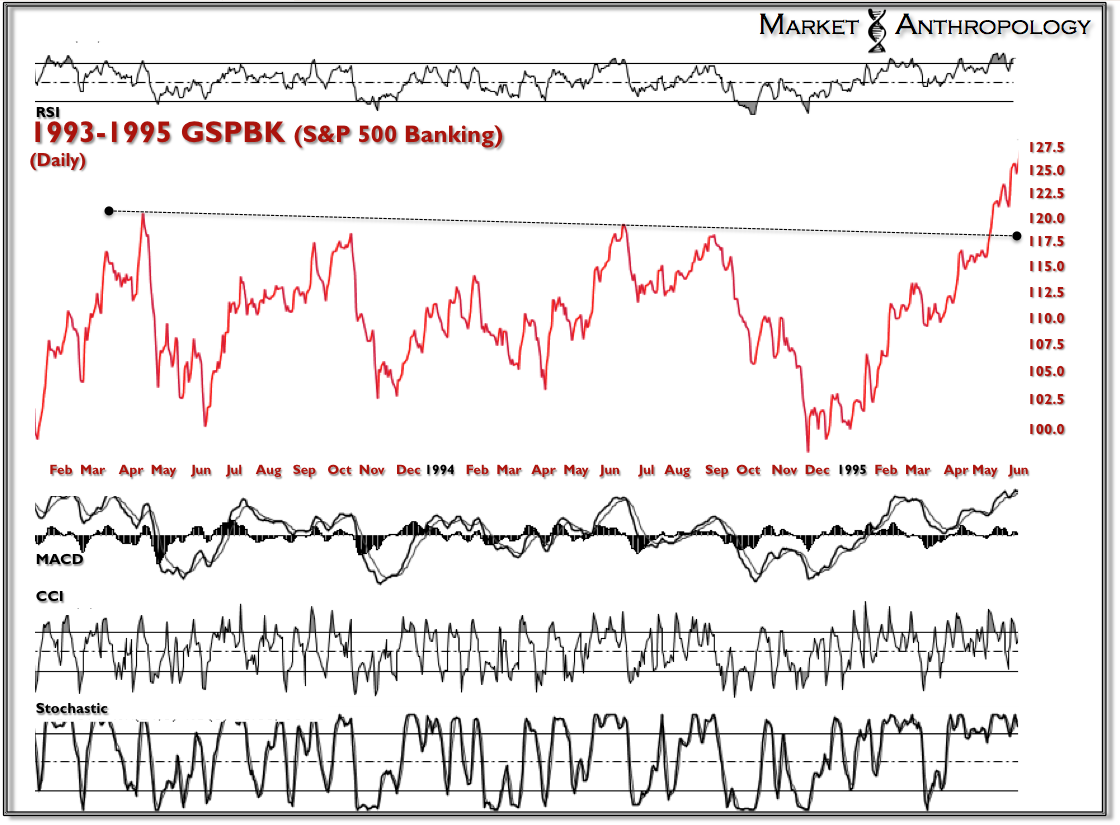
As mentioned in previous notes, the banking sector (post the 1990 crisis) traded in a wide, albeit declining range until late April of 1995.
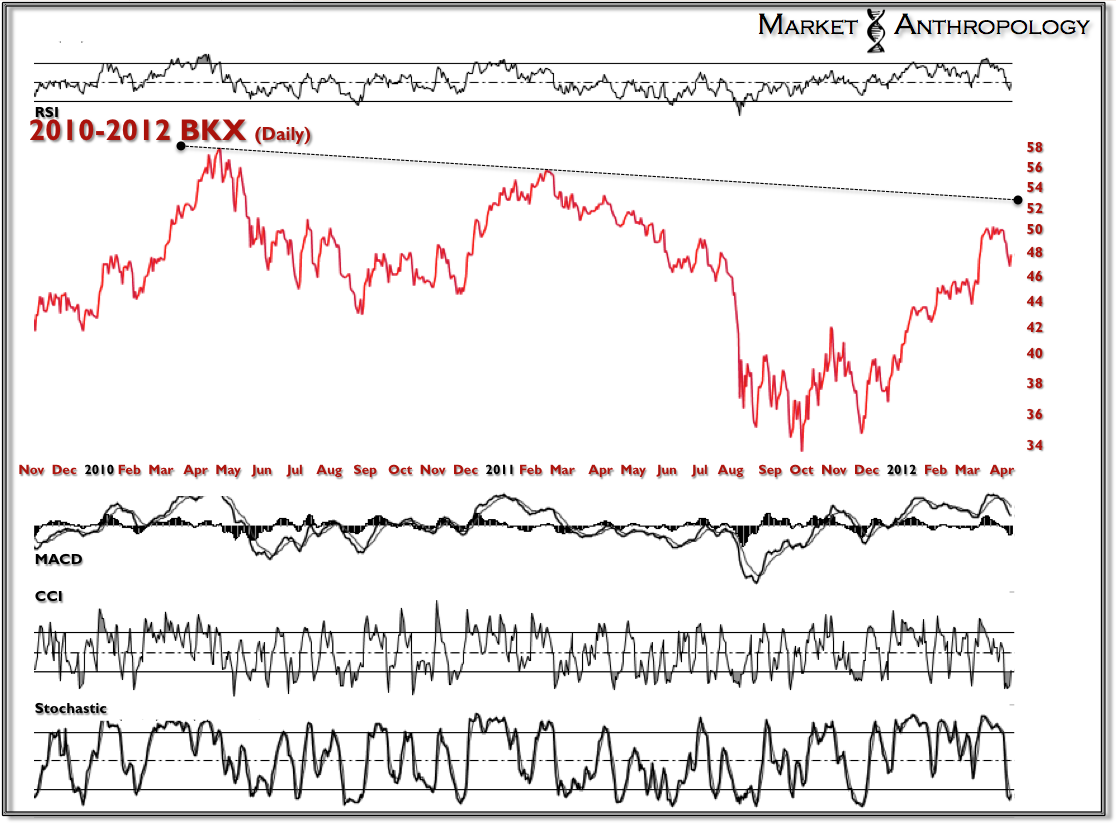
To my surprise, the banking sector has not only followed the same arc, but throughout 2012 has exhibited tremendous relative strength to the SPX.
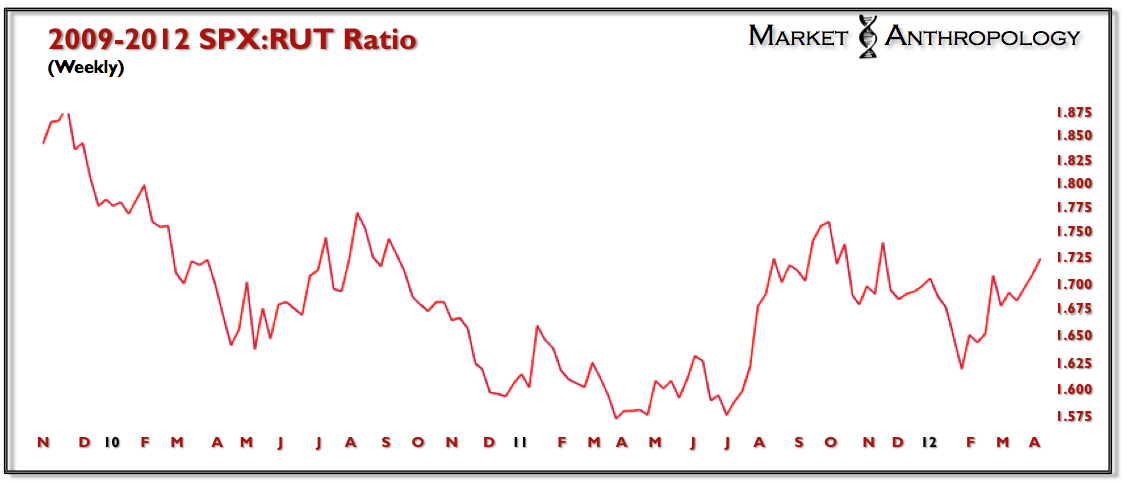
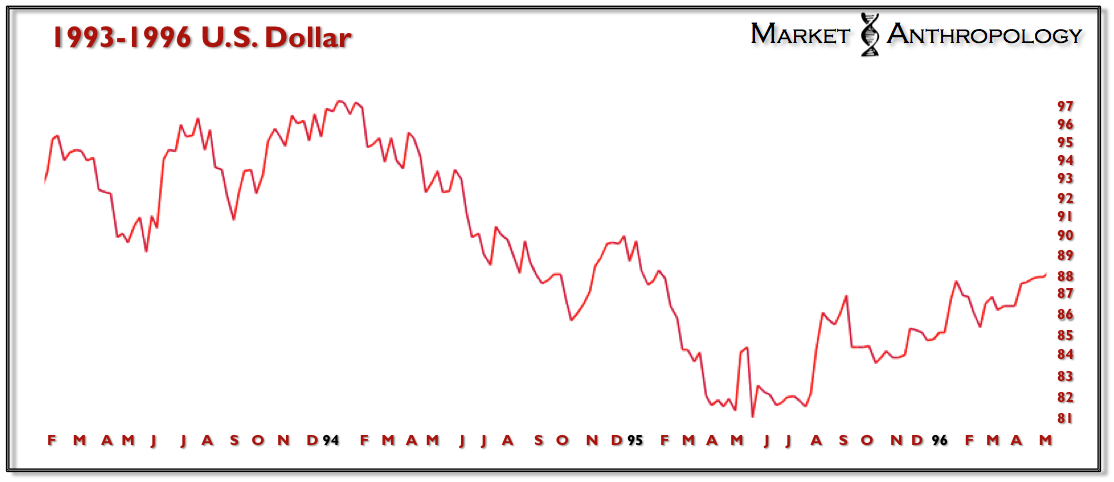
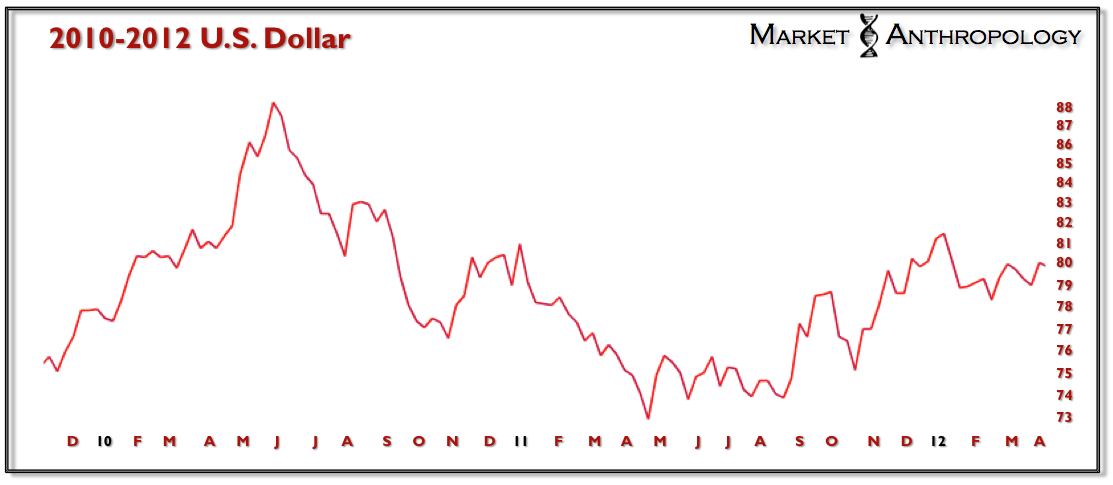
It should also be noted that the current market environment appears to be following the 1994-1996 secular shift that transitioned from a weakening to a strengthening currency and from an equity market that was led (on a relative basis) by large cap stocks.
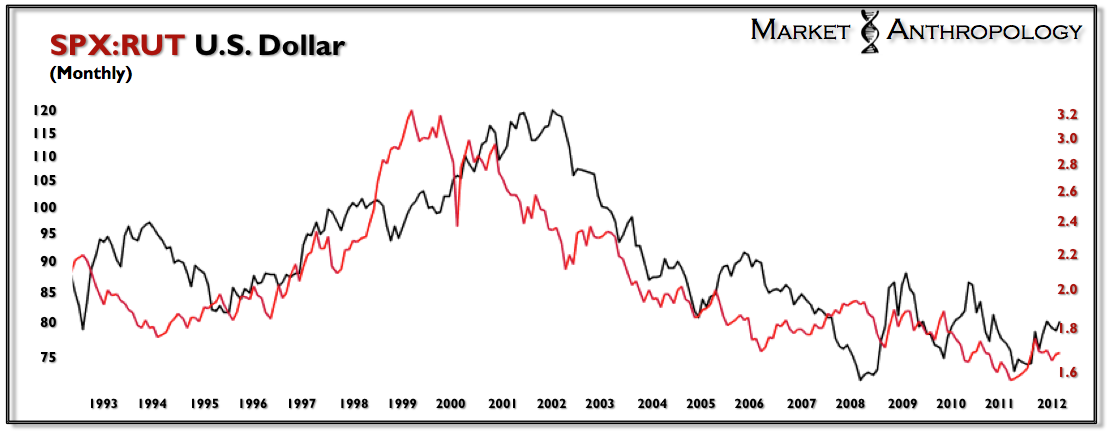
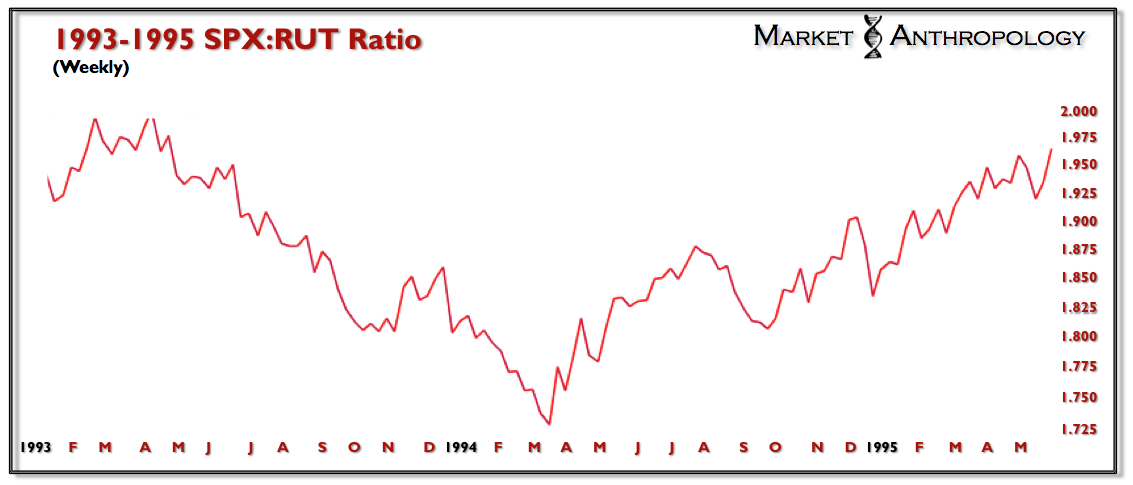
Both lows appear in the charts as inverted head and shoulders patterns.
In light of this past weeks rapid decline, I find it noteworthy that the SPX also retested the initial 100% retracement breakout in March of 1995.

Should the breakout region around 1364 (daily) and today's recovery hold, I suspect the market will rapidly make its way back to the Meridian once again. As in 1994-1995, the market was initially rejected a year before it broke through and ushered in the uber-bull we now know as Irrational Exuberance. I find it interesting that there is a critical technical and fundamental (earnings season) window for the market to react in. In essence, it should be a binary outcome.

As mentioned in previous notes, the banking sector (post the 1990 crisis) traded in a wide, albeit declining range until late April of 1995.

To my surprise, the banking sector has not only followed the same arc, but throughout 2012 has exhibited tremendous relative strength to the SPX.

It should also be noted that the current market environment appears to be following the 1994-1996 secular shift that transitioned from a weakening to a strengthening currency and from an equity market that was led (on a relative basis) by large cap stocks.
3rd party Ad. Not an offer or recommendation by Investing.com. See disclosure here or remove ads.


Both lows appear in the charts as inverted head and shoulders patterns.


Which stock should you buy in your very next trade?
AI computing powers are changing the stock market. Investing.com's ProPicks AI includes 6 winning stock portfolios chosen by our advanced AI. In 2024 alone, ProPicks AI identified 2 stocks that surged over 150%, 4 additional stocks that leaped over 30%, and 3 more that climbed over 25%. Which stock will be the next to soar?
Unlock ProPicks AI