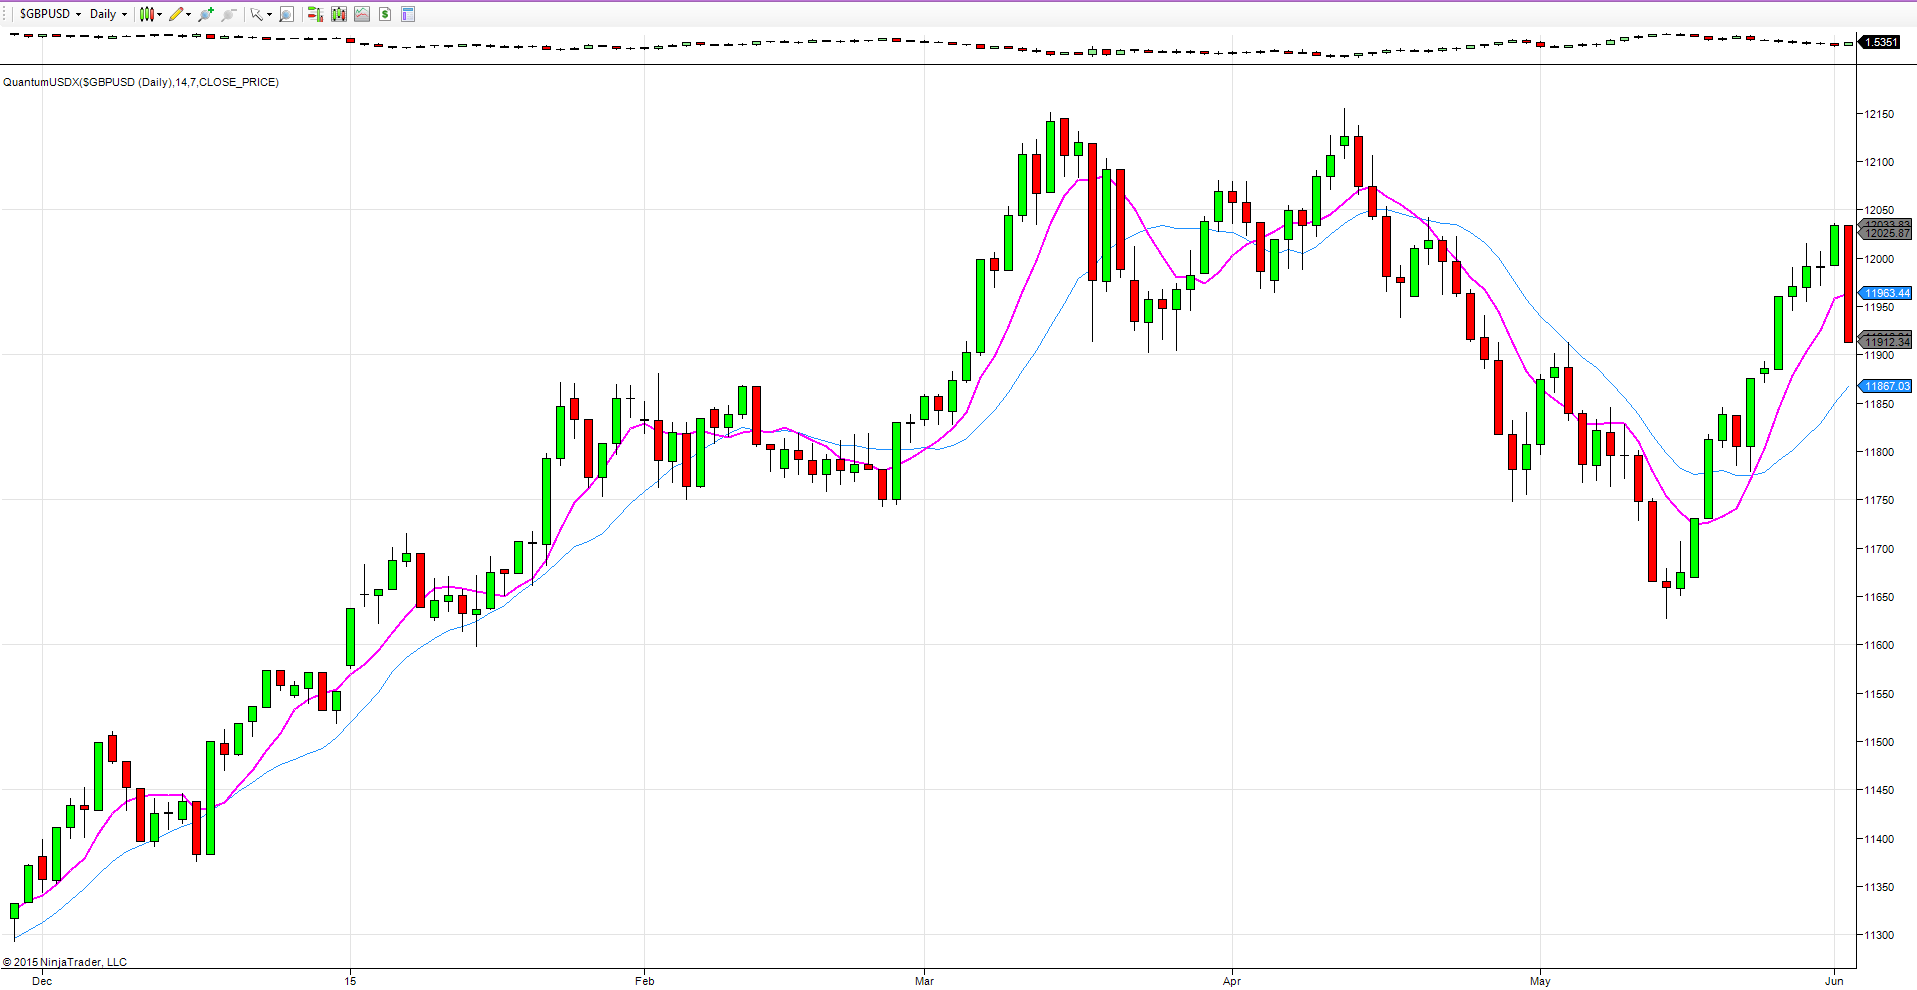
Yesterday was another fascinating day on the forex markets with some big moves on the principle indices of the US dollar index, the yen index and the euro index. If we begin with the US dollar index, the sharp move lower has seen the index fall from Monday’s close of 12,034 to currently trade at 11,911, moving lower still at the time of writing.
Yesterday’s fall is against the background of thin economic news, and largely triggered by the comments of FOMC Member Brainard who suggested a wait and see approach to an interest rate rise was more appropriate given the fragile nature of the US economy at present. In some respects this was no great surprise given her dovish stance. What was therefore more surprising was the reaction of the index, which move strongly on the comment.
However, what perhaps helped to reinforce this view was the Factory Orders number which came in at -0.4% against a forecast of 0% and reversing the positive number last time around, with the data and comments then combining to send the US dollar lower on the index, wiping out the gains of the last few days. Whilst the candle closed the day as a bearish engulfing signal, below is a strong platform of potential support in the 11,870 region, and provided this holds firm, then we should see a bounce and recovery in due course. However, with Non Farm Payrolls now looming on the horizon, and US Trade Balance figures today, Monday’s reaction could be reversed equally quickly over the next few days.

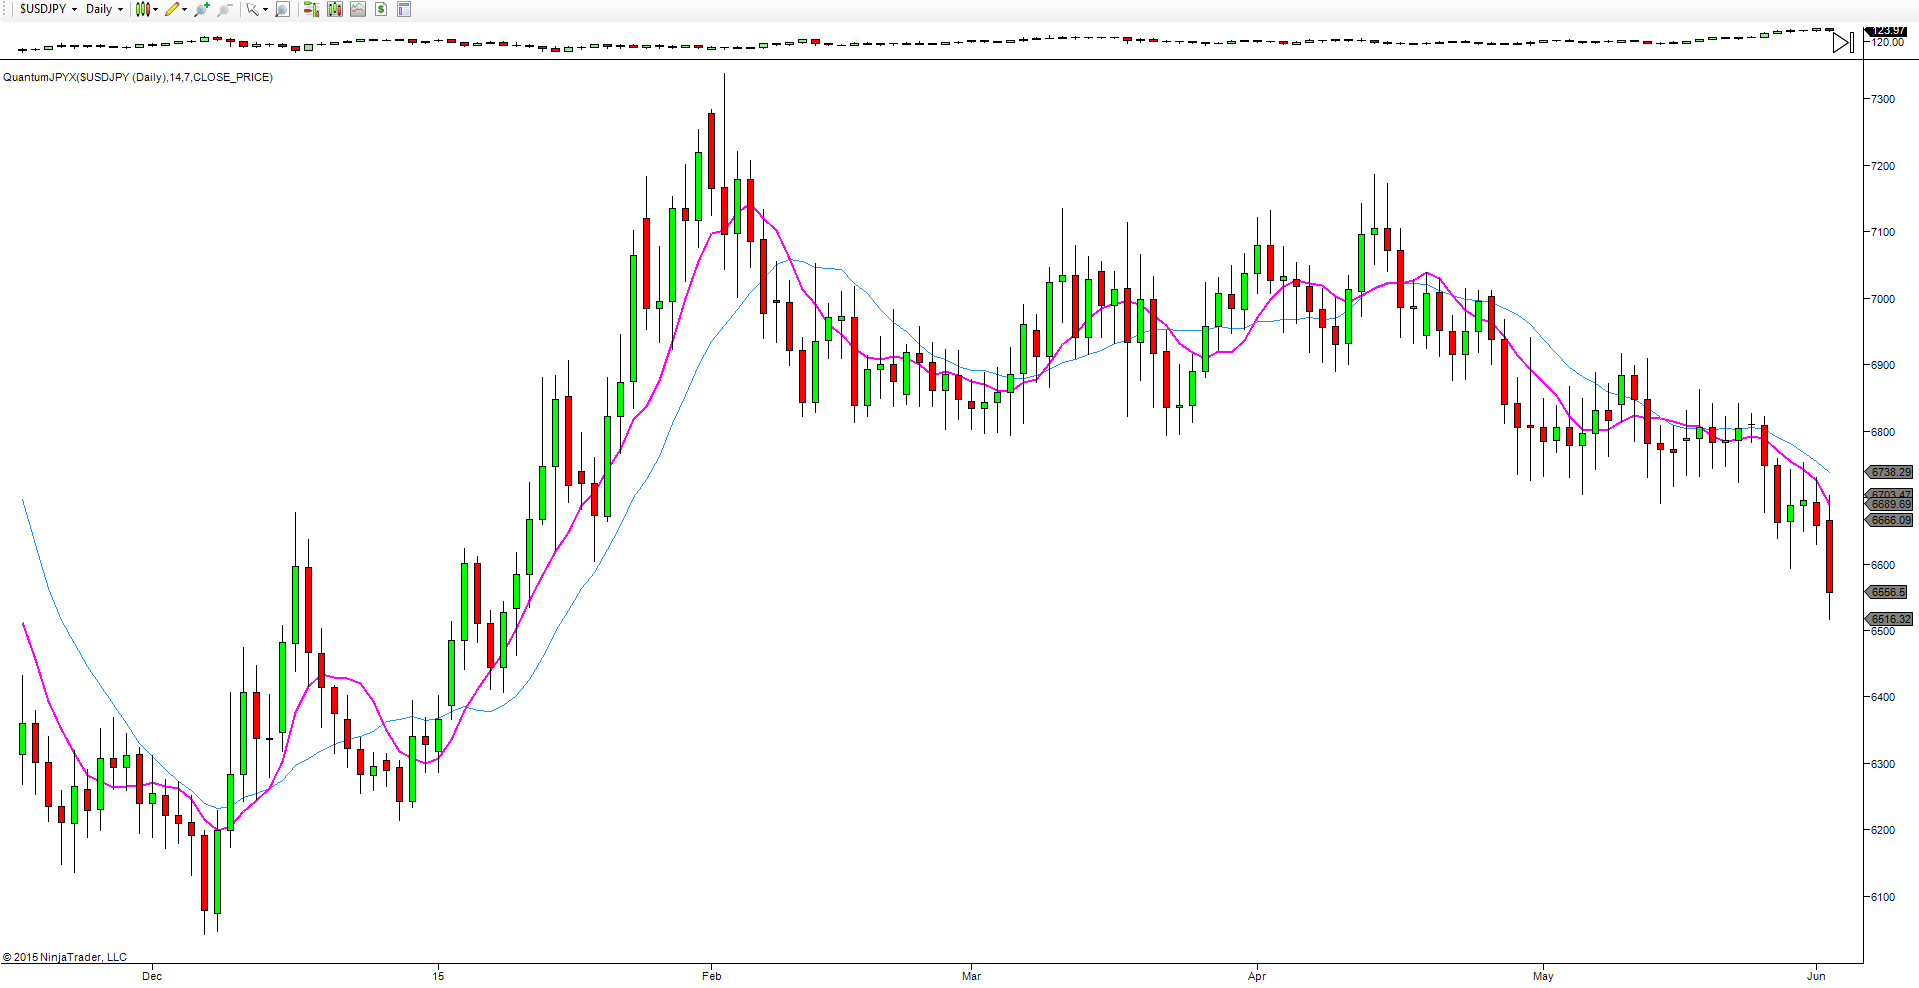
Moving to the yen index, this too has seen some big moves on the daily chart, with the index breaking away from the recent congestion phase in the 6660 region to currently trade at 6559 at time of writing. What is interesting here is the divergence in yen flows, with the AUD/JPY moving strongly higher and leading the EUR/JPY and GBP/JPY , whilst the USD/JPY has seen strong yen buying in this pair and counterbalancing the selling elsewhere. Nevertheless, the yen index continues to remain bearish. Provided we see a close below the 6600, then further yen weakness remains dominant with a move towards the 6430 region now on the horizon.

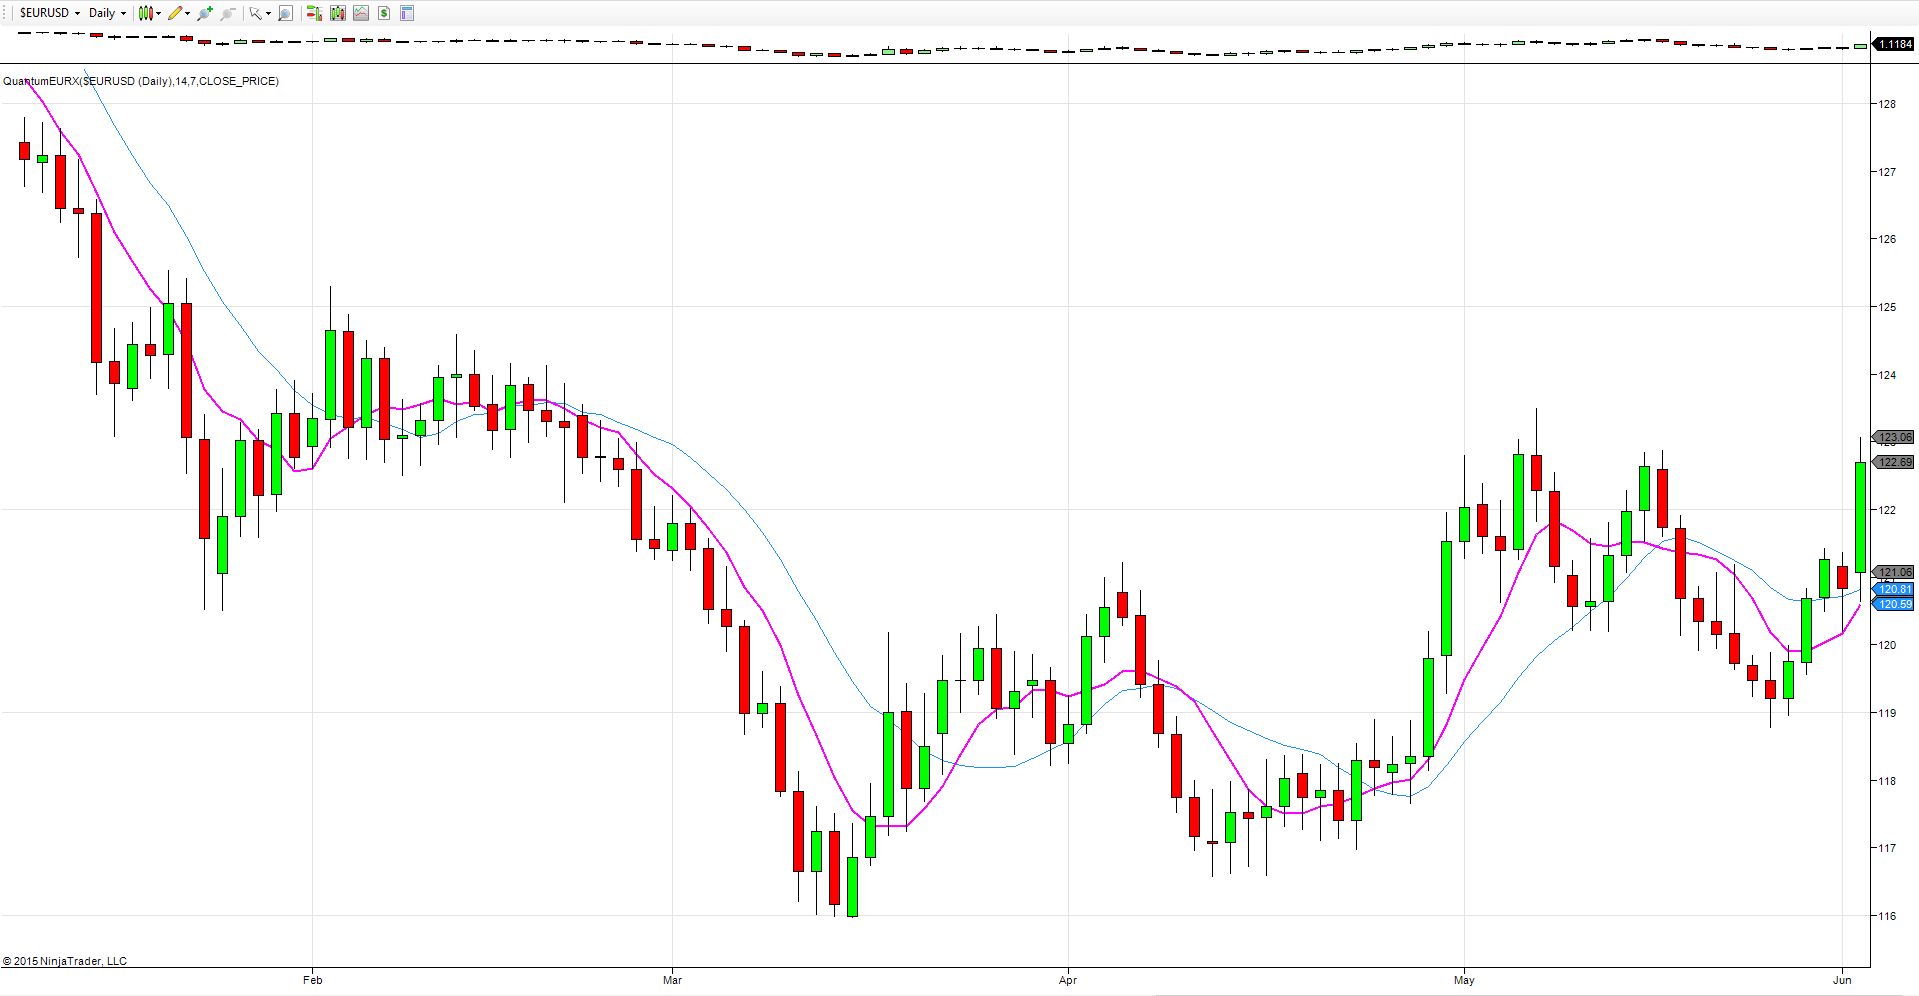
Finally to the euro index, which again saw some dramatic moves yesterday for the single currency, with the index climbing dramatically and moving firmly higher to test the resistance level now in place in the 123 region. Indeed, this level was already tested in trading yesterday, but for any continuation of the current bullish momentum this price level will need to be breached. If it is, then we can expect to see a further move higher for the euro against the basket of currencies, with a move to test the 124.40 region. As always though, much will depend on Greece, and a point worth mentioning here is this—there is no mechanism within the Treaty for a member state to be ejected. This has to be a decision taken by the member state itself,. Given this fact, we are more likely to see Germany leave than Greece! Turkeys don’t vote for Christmas so why would the Greeks!
Which stock should you buy in your very next trade?
With valuations skyrocketing in 2024, many investors are uneasy putting more money into stocks. Unsure where to invest next? Get access to our proven portfolios and discover high-potential opportunities.
In 2024 alone, ProPicks AI identified 2 stocks that surged over 150%, 4 additional stocks that leaped over 30%, and 3 more that climbed over 25%. That's an impressive track record.
With portfolios tailored for Dow stocks, S&P stocks, Tech stocks, and Mid Cap stocks, you can explore various wealth-building strategies.
