Perhaps my favorite tool for measuring strength is breadth, which simply measures the percentage of constituents advancing or declining within a group or index. You can apply it to any financial market or economic series to gauge how robust an advance is. During a bull market or economic expansion you would expect breadth to be very strong where the bulk of stocks are rallying and the bulk of the country is showing economic growth. During a recession you would expect the opposite: the bulk of stocks are in their own private bear markets and various segments of the economy are contracting. Not only does breadth reveal whether you have a bearish or bullish backdrop but it can also help in spotting turning points for when the stock market is transitioning from a bull to a bear market or when the economy is slipping from expansion to contraction (recession). So, what does breadth reveal about the stock market and economy right now?
Stock Market Breadth
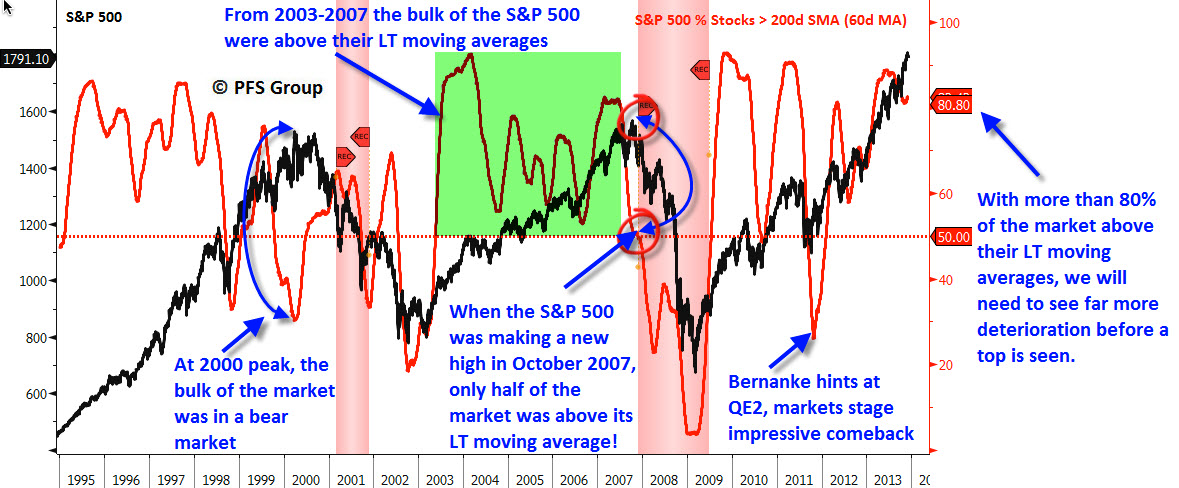
For today’s article I’m going to present one of the more common measures of breadth, which is the percent of stocks above their long-term moving average (200-DMA). During healthy bull markets the bulk of the S&P 500 members are above their 200-DMA. When the market becomes split with only half the stocks above and the other half below (see chart below), this is a warning sign that the market may be close to a peak. Currently, market breadth is very strong with over 80% of stocks in long-term upward trends and does not indicate a top is in the process of being formed.
Economic Breadth
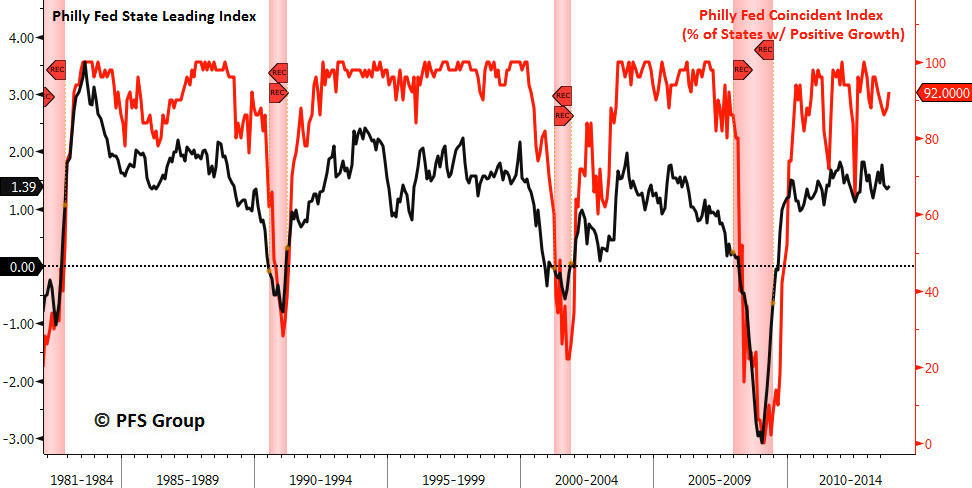
One of my favorite measures of economic breadth are the coincident and leading state indexes that the Philadelphia Fed conducts. Rather than measure national economic activity, they measure each state’s own economic activity, which allows us to measure economic breadth across all 50 states. In robust expansions the bulk of states should be witnessing economic growth and during recessions we expect the opposite. Thus, looking at the percentage of states showing growth gives a good sense of how robust a recovery is. Shown below are the Philly Fed’s Coincident Diffusion Index (in red), which calculates the percentage of states with flat to positive growth, and then the Philly Fed’s Sate Leading Index (in black). As you can see below, more than 92% of the 50 states in the US are experiencing economic growth and the risk of a recession is quite remote. Typically when a recession (shown by the red bars) begins only half of the states are growing and so with the current reading of 92%, we can be fairly confident the economy will continue to expand into 2014.
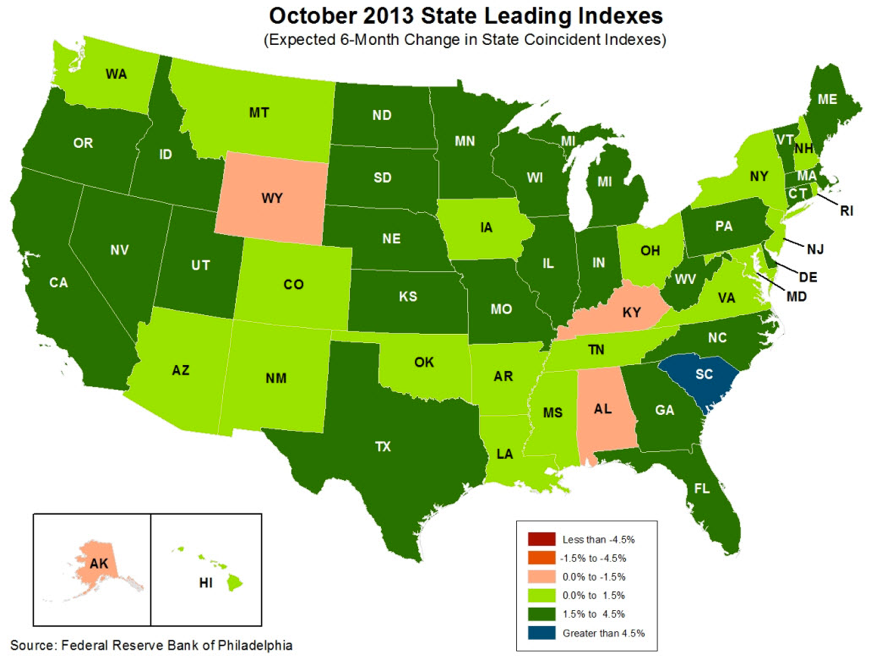
 What is also encouraging is that the Philly Fed’s State leading Index is comfortably above the 1% growth level, indicated by the number of "green" states below. Typically, we see a continued decline in each state prior to the onset of a recession and then a dip below 0% when a recession begins. The fact that we are not declining and well above the 0% level is encouraging and not surprising when 92% of the country is experiencing economic growth. A simple glance below at a sea of green shows we have a robust recovery with a low probability of a recession.
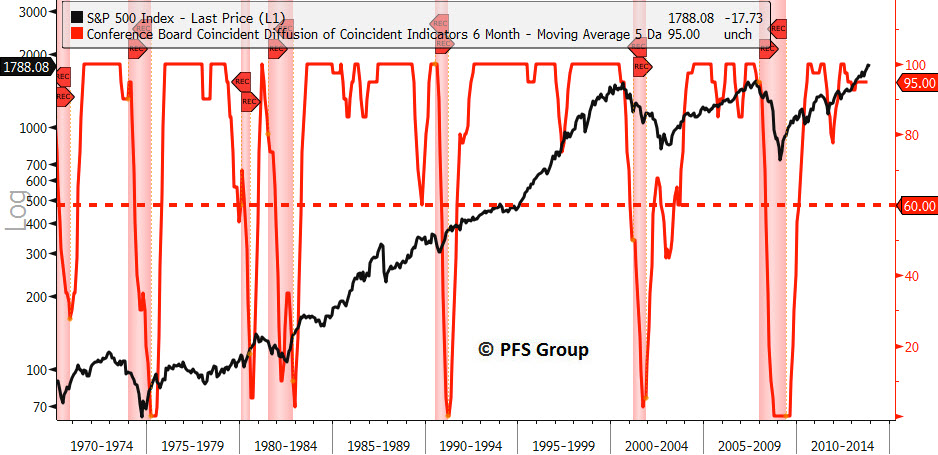
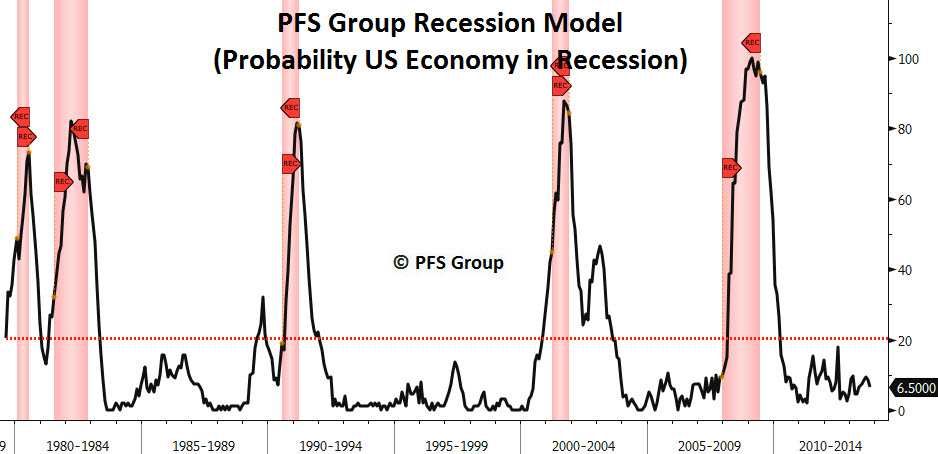
Another measure of economic breadth is the Conference Board’s Coincident Diffusion Index, which is often helpful in giving advance warning of recessions and slowdowns in the market, as seen below. Currently, it has a very strong reading at 95% and, in conjunction with the information above, helps to explain the very low, 6.5%, probability of an economic recession according to our Recession Model also shown below.
Economic Momentum Building into 2014
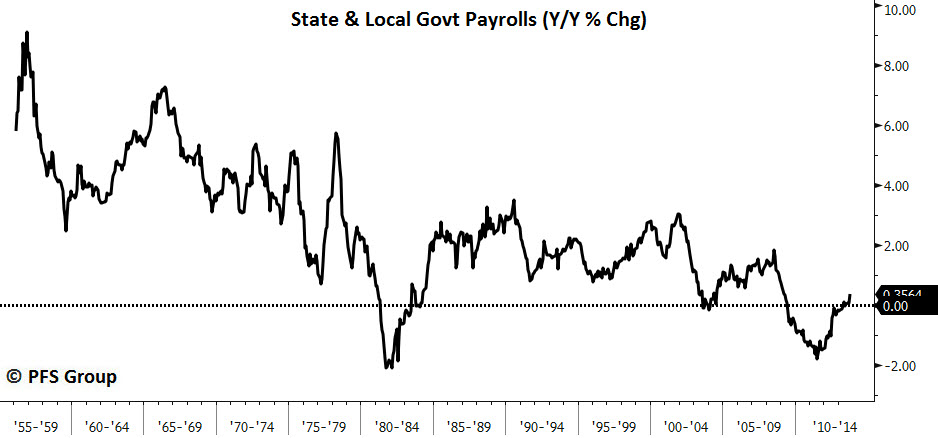
Perhaps THE biggest anchor holding back the economy post the 2007-2009 recession was housing, which continually subtracted from GDP growth. Another drag on the economy were the state/local and federal government sectors which were undergoing a measure of austerity by cutting payrolls and trimming budgets as revenue collapsed during the recession. Interestingly, the month the recession ended government employment growth went negative and stayed negative the entire recovery until moving into positive territory this spring and is now accelerating higher.
Another reason why the government sector is likely to add to growth going forward is that tax revenues are improving along with the housing recovery. Property tax revenue follows housing prices with a lag and the recent increase in housing prices suggests property tax revenue growth stops decelerating and picks up sharply heading into the middle of 2016.

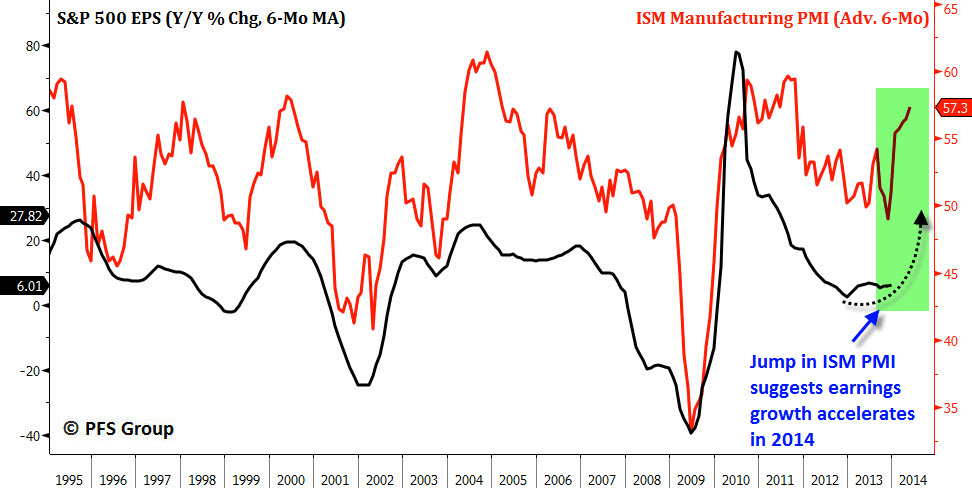
Corporations are also likely to see a pick-up in sales and earnings heading into next year as suggested by the ISM Manufacturing PMI. The PMI typically leads earnings growth for the S&P 500 by six months and the declining trend in the PMI that occurred from 2011-2013 ended this year with the sharp move to 57.3 and suggests the slowing earnings picture we’ve seen since 2011 should fade and lead to higher growth rates going into 2014.
Summary
There will come a time to be bearish, but I believe that time is clearly not now. You have too many areas of the financial market and economy that are participating to the upside to suggest a bull market top or recession is looming on the horizon. When we see fewer stocks in bullish trends and fewer states chugging along, that will be the time to turn towards wealth preservation rather than wealth maximization. I will continue to monitor stock market breadth in my Friday “Market’s Bill of Health” reports and will update readers on any significant changes in economic breadth indicators.
Stock Market Breadth
For today’s article I’m going to present one of the more common measures of breadth, which is the percent of stocks above their long-term moving average (200-DMA). During healthy bull markets the bulk of the S&P 500 members are above their 200-DMA. When the market becomes split with only half the stocks above and the other half below (see chart below), this is a warning sign that the market may be close to a peak. Currently, market breadth is very strong with over 80% of stocks in long-term upward trends and does not indicate a top is in the process of being formed.
3rd party Ad. Not an offer or recommendation by Investing.com. See disclosure here or remove ads.
Economic Breadth
One of my favorite measures of economic breadth are the coincident and leading state indexes that the Philadelphia Fed conducts. Rather than measure national economic activity, they measure each state’s own economic activity, which allows us to measure economic breadth across all 50 states. In robust expansions the bulk of states should be witnessing economic growth and during recessions we expect the opposite. Thus, looking at the percentage of states showing growth gives a good sense of how robust a recovery is. Shown below are the Philly Fed’s Coincident Diffusion Index (in red), which calculates the percentage of states with flat to positive growth, and then the Philly Fed’s Sate Leading Index (in black). As you can see below, more than 92% of the 50 states in the US are experiencing economic growth and the risk of a recession is quite remote. Typically when a recession (shown by the red bars) begins only half of the states are growing and so with the current reading of 92%, we can be fairly confident the economy will continue to expand into 2014.
What is also encouraging is that the Philly Fed’s State leading Index is comfortably above the 1% growth level, indicated by the number of "green" states below. Typically, we see a continued decline in each state prior to the onset of a recession and then a dip below 0% when a recession begins. The fact that we are not declining and well above the 0% level is encouraging and not surprising when 92% of the country is experiencing economic growth. A simple glance below at a sea of green shows we have a robust recovery with a low probability of a recession.3rd party Ad. Not an offer or recommendation by Investing.com. See disclosure here or remove ads.
Another measure of economic breadth is the Conference Board’s Coincident Diffusion Index, which is often helpful in giving advance warning of recessions and slowdowns in the market, as seen below. Currently, it has a very strong reading at 95% and, in conjunction with the information above, helps to explain the very low, 6.5%, probability of an economic recession according to our Recession Model also shown below.
Economic Momentum Building into 2014
Perhaps THE biggest anchor holding back the economy post the 2007-2009 recession was housing, which continually subtracted from GDP growth. Another drag on the economy were the state/local and federal government sectors which were undergoing a measure of austerity by cutting payrolls and trimming budgets as revenue collapsed during the recession. Interestingly, the month the recession ended government employment growth went negative and stayed negative the entire recovery until moving into positive territory this spring and is now accelerating higher.
Another reason why the government sector is likely to add to growth going forward is that tax revenues are improving along with the housing recovery. Property tax revenue follows housing prices with a lag and the recent increase in housing prices suggests property tax revenue growth stops decelerating and picks up sharply heading into the middle of 2016.
Corporations are also likely to see a pick-up in sales and earnings heading into next year as suggested by the ISM Manufacturing PMI. The PMI typically leads earnings growth for the S&P 500 by six months and the declining trend in the PMI that occurred from 2011-2013 ended this year with the sharp move to 57.3 and suggests the slowing earnings picture we’ve seen since 2011 should fade and lead to higher growth rates going into 2014.
3rd party Ad. Not an offer or recommendation by Investing.com. See disclosure here or remove ads.
Summary
There will come a time to be bearish, but I believe that time is clearly not now. You have too many areas of the financial market and economy that are participating to the upside to suggest a bull market top or recession is looming on the horizon. When we see fewer stocks in bullish trends and fewer states chugging along, that will be the time to turn towards wealth preservation rather than wealth maximization. I will continue to monitor stock market breadth in my Friday “Market’s Bill of Health” reports and will update readers on any significant changes in economic breadth indicators.
Which stock should you buy in your very next trade?
AI computing powers are changing the stock market. Investing.com's ProPicks AI includes 6 winning stock portfolios chosen by our advanced AI. In 2024 alone, ProPicks AI identified 2 stocks that surged over 150%, 4 additional stocks that leaped over 30%, and 3 more that climbed over 25%. Which stock will be the next to soar?
Unlock ProPicks AI