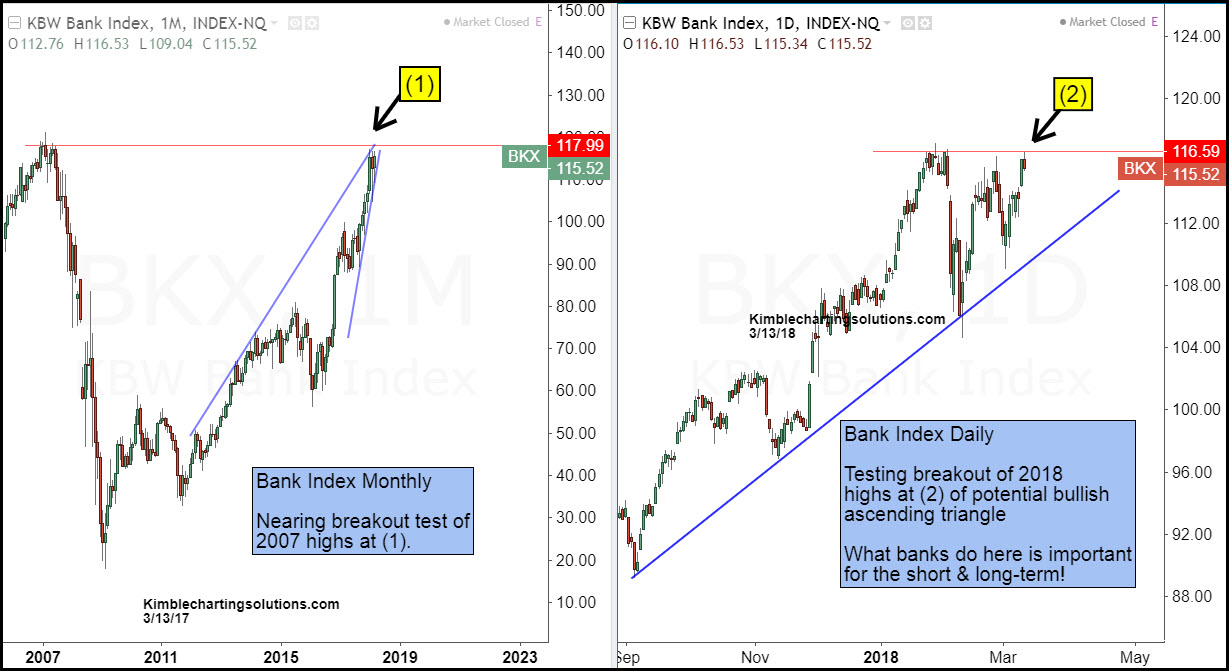
The 2-pack above looks at the KBW Nasdaq Global Bank on a monthly and daily basis. The monthly chart (left) highlights that the index is nearing the price level where it peaked in 2007 at (1). From a long-term perspective, this is an important test for this index and the broad market in general.
The daily chart (right) highlights that the index is testing 2018 highs at (2). The highs this year in the index could be the top of a bullish ascending triangle pattern. Two-thirds of the time, ascending triangle patterns breakout to the upside.
Bottom line- From a long and short-term perspective, banks are facing an important breakout or topping test.
Which stock should you buy in your very next trade?
AI computing powers are changing the stock market. Investing.com's ProPicks AI includes 6 winning stock portfolios chosen by our advanced AI. In 2024 alone, ProPicks AI identified 2 stocks that surged over 150%, 4 additional stocks that leaped over 30%, and 3 more that climbed over 25%. Which stock will be the next to soar?
Unlock ProPicks AI