Nvidia becomes first company to reach $4 trillion market cap amid AI boom
To me, avalanches have always been one of the most dramatic and terrifying of natural phenomena. In general, avalanches tend to occur after a seemingly small disturbance, such as new precipitation, animal movements (including humans) or a large rock dislodging. But there are usually advance warning signs that one is more likely to occur.
The same can be said of “avalanches” of buy or sell orders in financial markets. In the case of the current bullish-USD avalanche, the warning signs came from diverging monetary policy in a low-yielding world and continued deflation in the Eurozone, one of the US’s biggest economic rivals. A singular disturbance is difficult to pinpoint in this case, but the combination of continued dovish rhetoric from the ECB and Friday’s strong NFP report, raising the probability of a June rate hike by the Federal Reserve. The most powerful avalanches can reach speeds of over 300km per hour, and the pace of dollar buying this week no doubt reached the trading equivalent of that. But the most important question on traders’ minds is, 'Will the dollar buying continue?'
In the short term, we’re inclined to go with the flow. From a fundamental perspective, much of the current strength stems from the likelihood that the Federal Reserve will remove its patient pledge from the FOMC statement next week, and there is still plenty of time for the current bullish frenzy to draw in more traders. That said, dollar bulls may be getting ahead of themselves on a more medium-term basis; after all, the Fed is almost certainly on hold until June at the earliest and the recent bout of dollar strength may be due to much of the central bank’s preparation for it by decreasing the costs of imports while raising the prices of US exports.
Technical View: Dollar Index
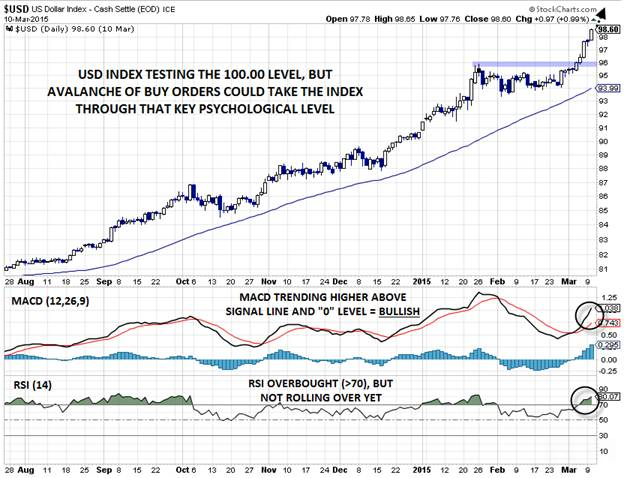
We’ve been checking in on the dollar Index fairly regularly (see here and here) because it provides an at-a-glance overview of the greenback’s performance against its major developed world rivals. By mid-day Wednesday, the dollar index had come within 0.01 points of the psychologically-significant 100 level, which, as we noted in Tuesday's USD/CHF discussion, is close enough to the century level for government work. (note that the below chart does not reflect Wednesday's strong bullish candle.)
The index is now deeply overbought, with a daily RSI reading above 80, but that’s not necessarily a sign of an imminent pullback as we saw a similarly overbought reading endure for nearly a month last September. Meanwhile, the MACD indicator is trending higher above both its signal line and the “0” level, showing strong and growing bullish momentum. If these two indicators start to roll over, a short-term pullback toward the previous breakout level at 96.00 is possible. But in the immediate term, the preponderance of technical and fundamental evidence is pointing to more strength in the buck.
After all, it’s pointless to try to climb a mountain against the strength of an oncoming avalanche.

Source: FOREX.com
For more intraday analysis and market updates, follow us on twitter (@MWellerFX and @FOREXcom)
Which stock should you buy in your very next trade?
AI computing powers are changing the stock market. Investing.com's ProPicks AI includes 6 winning stock portfolios chosen by our advanced AI. In 2024 alone, ProPicks AI identified 2 stocks that surged over 150%, 4 additional stocks that leaped over 30%, and 3 more that climbed over 25%. Which stock will be the next to soar?
Unlock ProPicks AI