MARKET SNAPSHOT: 
Asia Roundup:
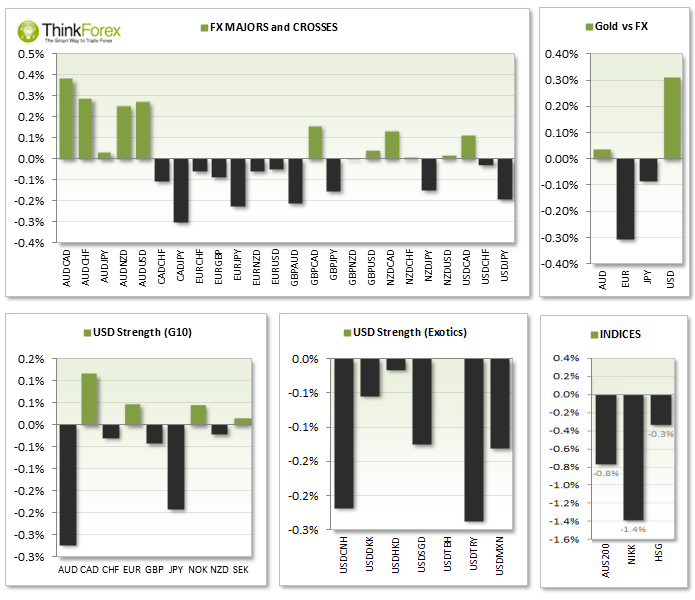
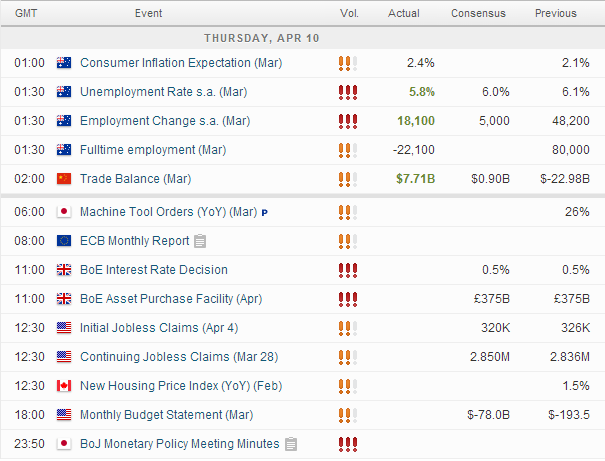
- AUD was easily the strongest currency in Asia trading as A###CONTENT###nbsp;erupted through 0.940 resistance following the surprise employment data today; Unemployment came in 5.8% vs 6.1% and the lowest n 3 months whilst job creation also came in positive at 18.1k vs 7.43 forecast; Moody's credit rating agency stated that Australian Banks are capable of meeting nearly all upcoming regulatory capital requirements.
- CNY Chinese exports fell below expectations
- JPY Core Machinery orders up 10.8% y/y but down -8.8% m/m; Ryuzo Miyao, a long-term pessimist over the Japanese economy has hinted he is more confident of the outlook for Japan stating that "Risks are largely balanced".
- NZD Manufacturing Index at an 8-month high at 58.40;
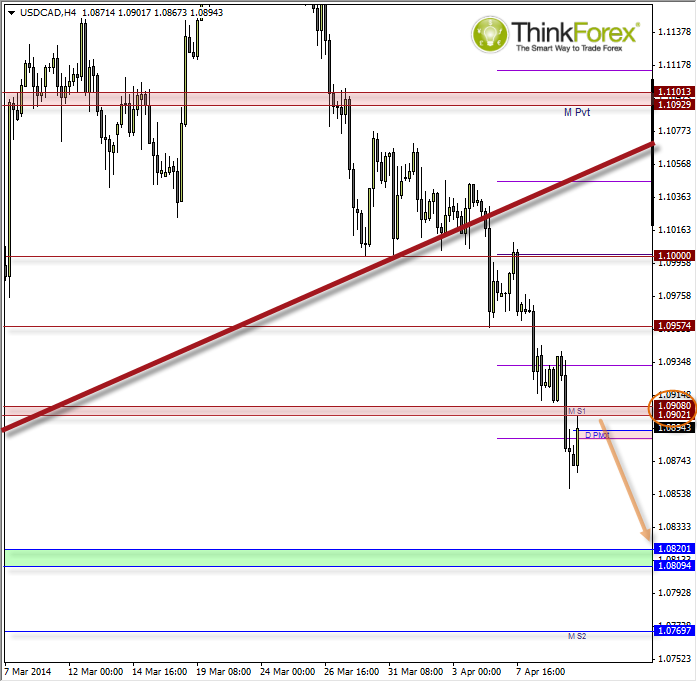
USD/CAD: Below 1.091 targets 1.082
I have been closely monitoring this in the lead-up to NFP when price repeatedly tested 1.10, to eventually break down through this pivotal level and present us with this new trend.
Since breaking 1.10 it has respected our key levels very well indeed (these levels were drawn in during the NFP webinar). We can see how each time price has broken through a level of support, retested it as resistance, then down to the next target.
With any luck we will see the same pattern here as long as we remain below 1.091.
At time of writing we are meandering around the daily pivot, so intraday traders may want to consider short position below the daily pivot. However for those who prefer to swing trade the H4 or H1 candles then we can allow for some noise above the daily pivot, and even above 1.091, as long as we close beneath this level.
For example of we produce a series of reversal candles with failed attempts to close above 1.091 (such as Hanging Men Candles) then we could take this as a signal to target 1.082.
If we convincingly break above 1.091 I would prefer to step aside, whereas a break above 1.0935 swing high would warn of a trend reversal for the near-term.
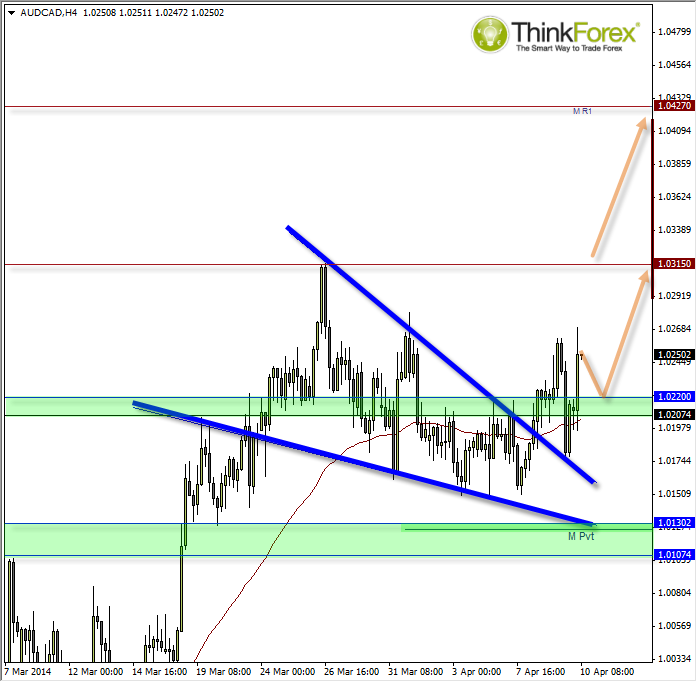
AUD/CAD: Bullish Wedge targets 1.0315
For the past week or so these 2 commodity currencies have both enjoyed being the more bullish of the bunch, and as we had covered during our live analysis webinar, at some point one of them would have to become the stronger of the two.
AUD appears to have tipped its hand and broken out of a bullish wedge to the upside. Whilst the pattern itself can be tricky to trade, it does provide a likely direction and target to trade to.
What adds extra weight to the validity of the wedge is how price retraced to the breakout line and respected it as support before taking another leg higher.
We are currently holding above a support zone between 1.020-22 where any retracement towards this zone may provide bullish opportunities on lower timeframes.
Which stock should you buy in your very next trade?
AI computing powers are changing the stock market. Investing.com's ProPicks AI includes 6 winning stock portfolios chosen by our advanced AI. In 2024 alone, ProPicks AI identified 2 stocks that surged over 150%, 4 additional stocks that leaped over 30%, and 3 more that climbed over 25%. Which stock will be the next to soar?
Unlock ProPicks AI
