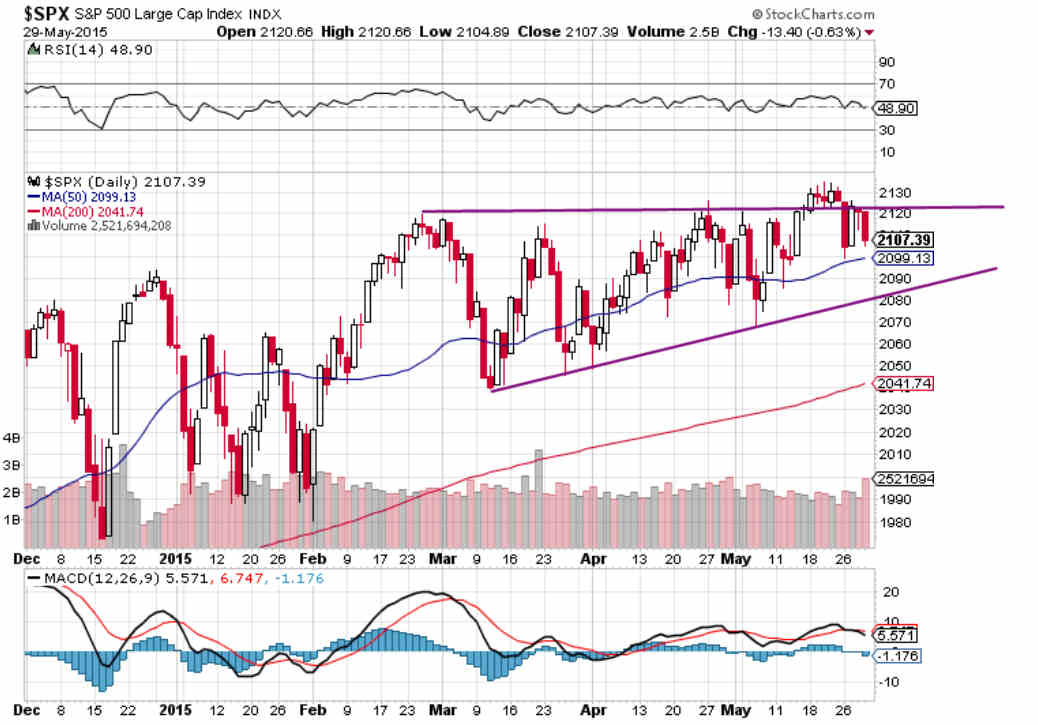
On May 16 I posted that the impending ascending triangle breakout on the ES daily chart was likely to be a fake-out.

The Breakout from the S&P 500 Ascending Triangle was Brief
Last Tuesday the S&P 500 reentered the formation. On Wednesday, the S&P 500 retested the formation top. On Friday the S&P 500 closed inside the triangle for the day and for the week. The S&P 500 had roamed outside of the formation for five days, including the breakout day.
Once a breakout on an ascending triangle fails, the target becomes the formation low. At the moment, that’s at roughly the level of the 200 dma.
A retrace to the formation low would put a potential H&S on the chart. The right shoulder minimum retrace target would be ES 2080.
Which stock should you buy in your very next trade?
With valuations skyrocketing in 2024, many investors are uneasy putting more money into stocks. Unsure where to invest next? Get access to our proven portfolios and discover high-potential opportunities.
In 2024 alone, ProPicks AI identified 2 stocks that surged over 150%, 4 additional stocks that leaped over 30%, and 3 more that climbed over 25%. That's an impressive track record.
With portfolios tailored for Dow stocks, S&P stocks, Tech stocks, and Mid Cap stocks, you can explore various wealth-building strategies.

