U.S. consumer prices rise by 2.7% in June
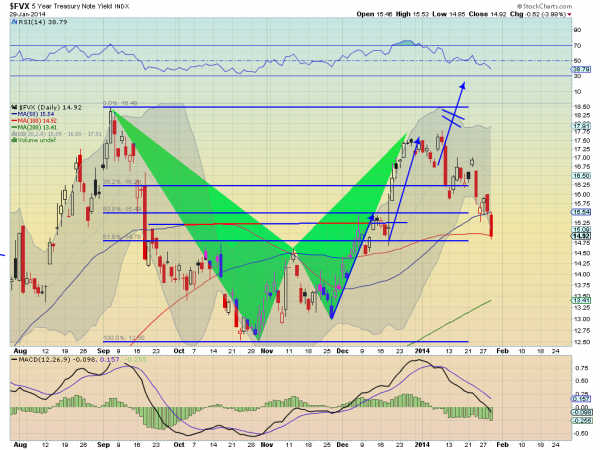
If the yield on the 5-yr. and 10-yr. Treasury keeps going lower -- and they want to call a bottom and reversal -- technically, this would be a good place for it. The chart of the 5-yr. yield below shows that the harmonic Bat won out over the 3 Drives pattern and it reversed lower shortly after reaching the Potential Reversal Zone (PRZ) at the point of the triangle January 9. But since then it has pulled back nearly 61.8% of the pattern, the target level, and is now also at the 100 day Simple Moving Average (SMA).
These are two good reasons for it to reverse in the 1.475-1.50% range. If it does not the pattern would look towards 1.25% next.
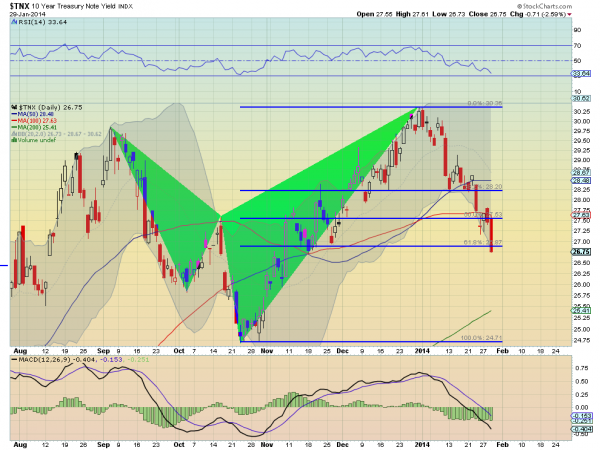
On the 10-yr. chart the move Wednesday took it below the 61.8% retracement of the Shark harmonic pattern. It is already in a spot to reverse. But it also printed a very bearish Marubozu candle Wednesday that augers for more downside. Should it continue lower then the next area to look for support is around 2.60% followed by the full retracement at 2.47%. I do not follow the supply and demand aspects or seasonality of the Treasury market anymore, but it seems if the Fed is slowing their purchases then these moves lower in yield are going to stop sometime.
Which stock should you buy in your very next trade?
AI computing powers are changing the stock market. Investing.com's ProPicks AI includes 6 winning stock portfolios chosen by our advanced AI. In 2024 alone, ProPicks AI identified 2 stocks that surged over 150%, 4 additional stocks that leaped over 30%, and 3 more that climbed over 25%. Which stock will be the next to soar?
Unlock ProPicks AI

