Bitcoin determines the trend for the entire cryptocurrency market. How is Ripple doing in this situation and where is it going next?In this post, I applied: all-round market view, market balance level, oscillators, correlation analysis, trading volume indicator, key levels.
Dear friends,
I’ll start with one of the most prominent highlights of this week. At Yahoo (NASDAQ:AABA) All Markets Summit in San-Francisco yesterday, SEC Director of the Division of Corporation Finance William Hinman announced Bitcoin and Ethereum not to be securities. That announcement deprives manipulators of another tool among information reasons to dump cryptocurrencies and press the market down.
In recent days, Bitcoin, following a series of strong dumps, has tested the level at about 6100 USD.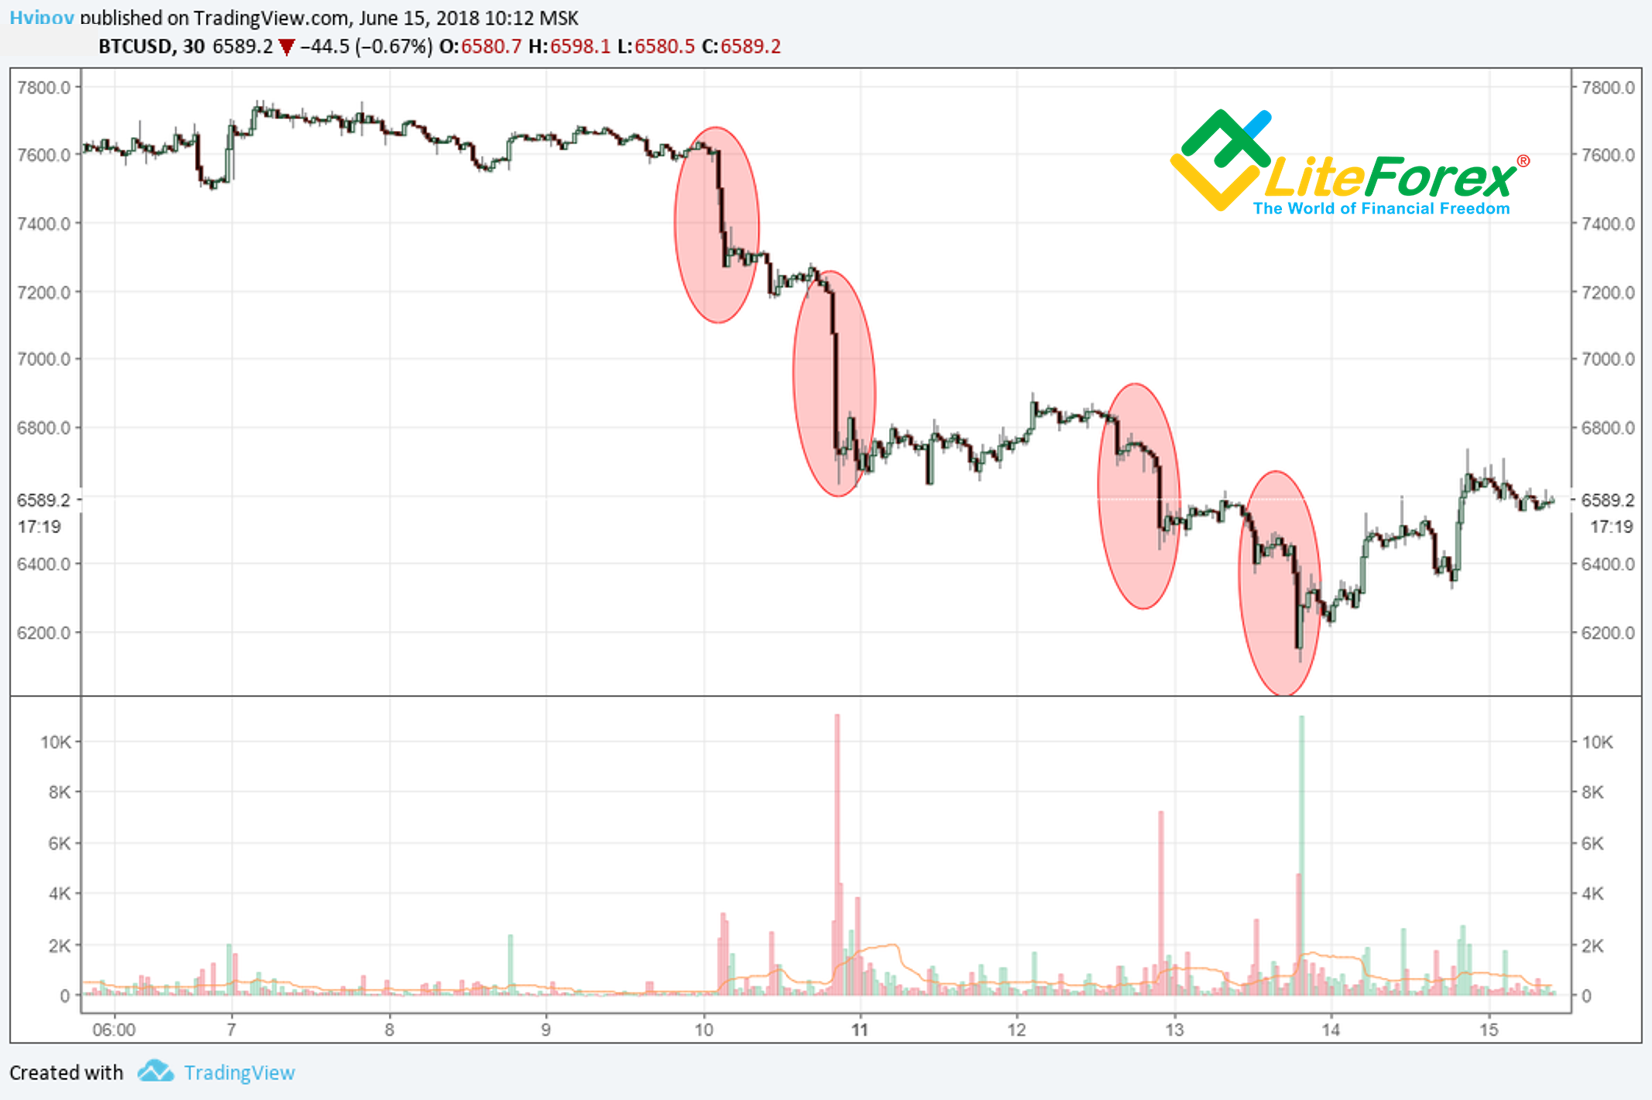
The dumps are clearly seen in the minute timeframes. I marked them with the red circles in the chart above.
Frankly speaking, after the recent news, I can hardly imagine any fresh news bits that may send BTC down lower. Almost all altcoins are already close to their lows, if not at them.
Currently, Bitcoin price is rolling back a little; and many wonder whether the bottom has been touched, or it is just a short pause in the fall.
Objectively speaking, according to technical analysis, there are yet no clear reversal signals.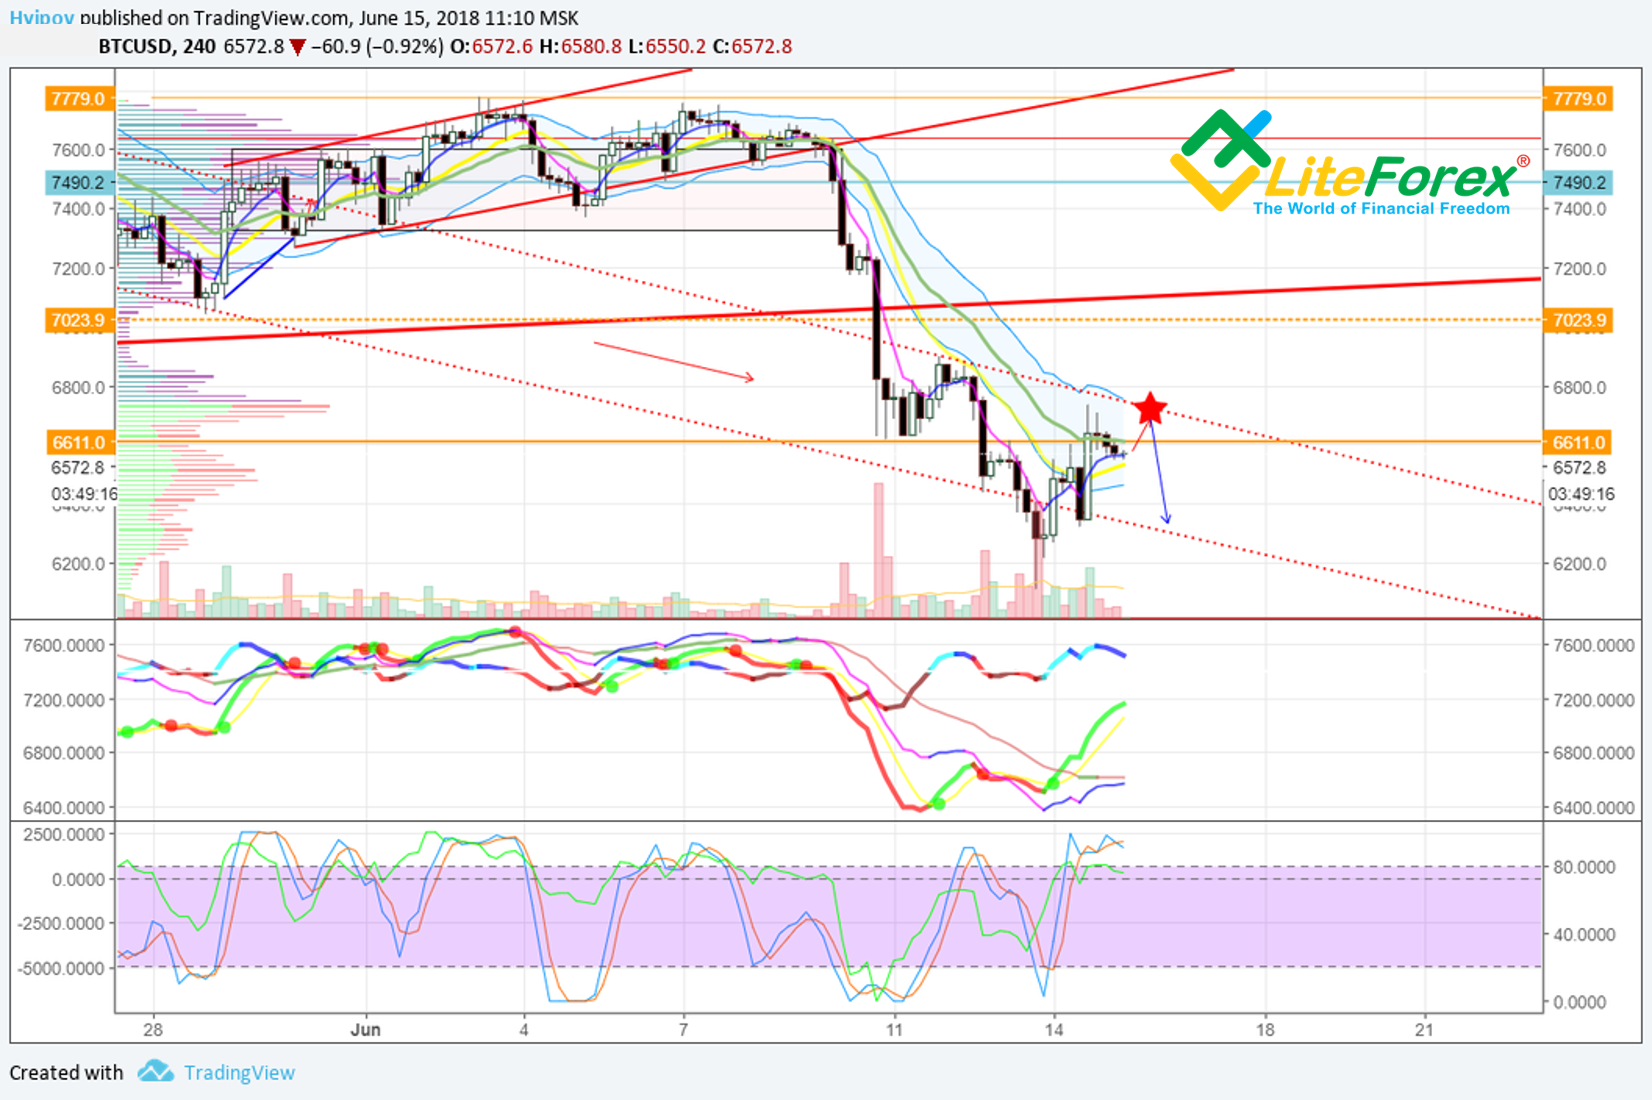
The ticker has stuck in the bearish channel with the top border at about 6700. The market is not strong enough to break through the former support level; there is no buy volume as well. It is the market’s usual state after mass selling; sellers have already exhausted and have nothing to sell, buyers are afraid to go long, as they still remember dramatic drops.
In this context, Bitcoin is the most likely to move inside the channel, bordered by 6300 from below, and 6700- from above.
Having defined the next Bitcoin moves, let’s discuss other altcoins. Although, most of this article is devoted to BTC, in fact, I’d like to analyze Ripple.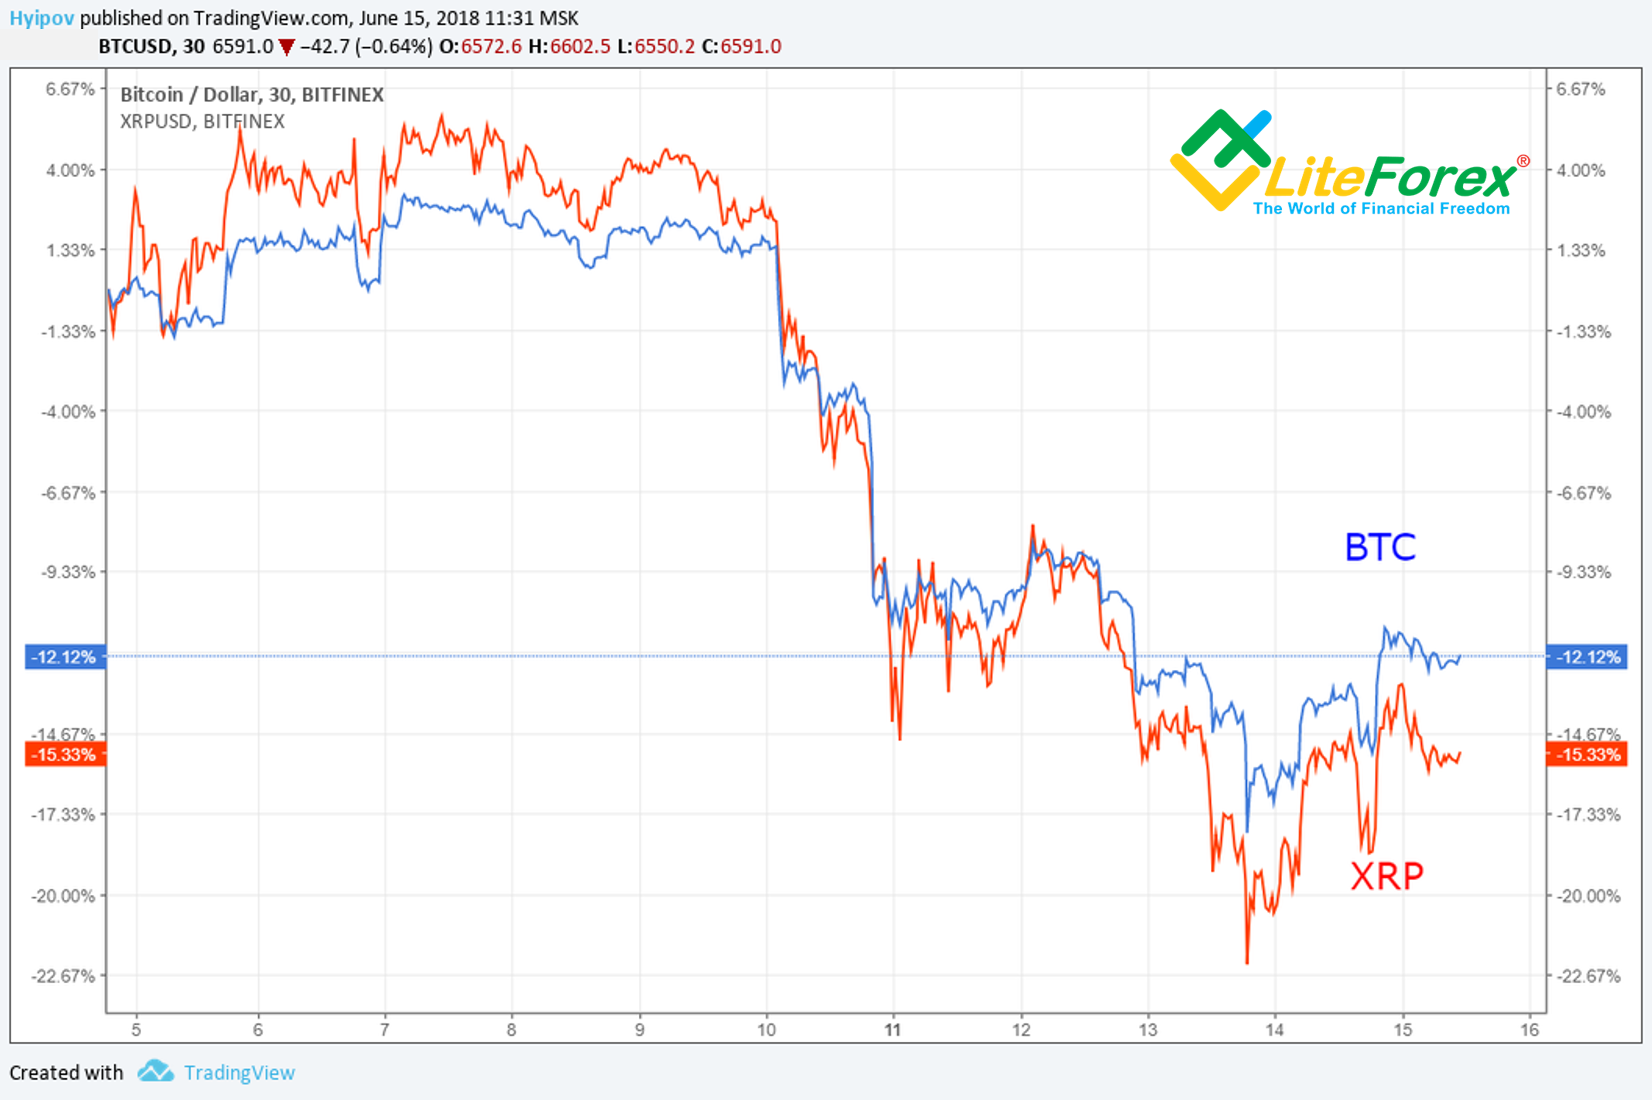
If so, then why have I started with BTC? The answer is in the chart above.
As you see, BTC and XRP very closely correlate to each other; therefore, when you try to forecast this altcoin’s future, it is very important to consider Bitcoin’s future moves.
Before we continue, I’d like to show off a little and note that the last forecast for XRP/USD has 100% worked out.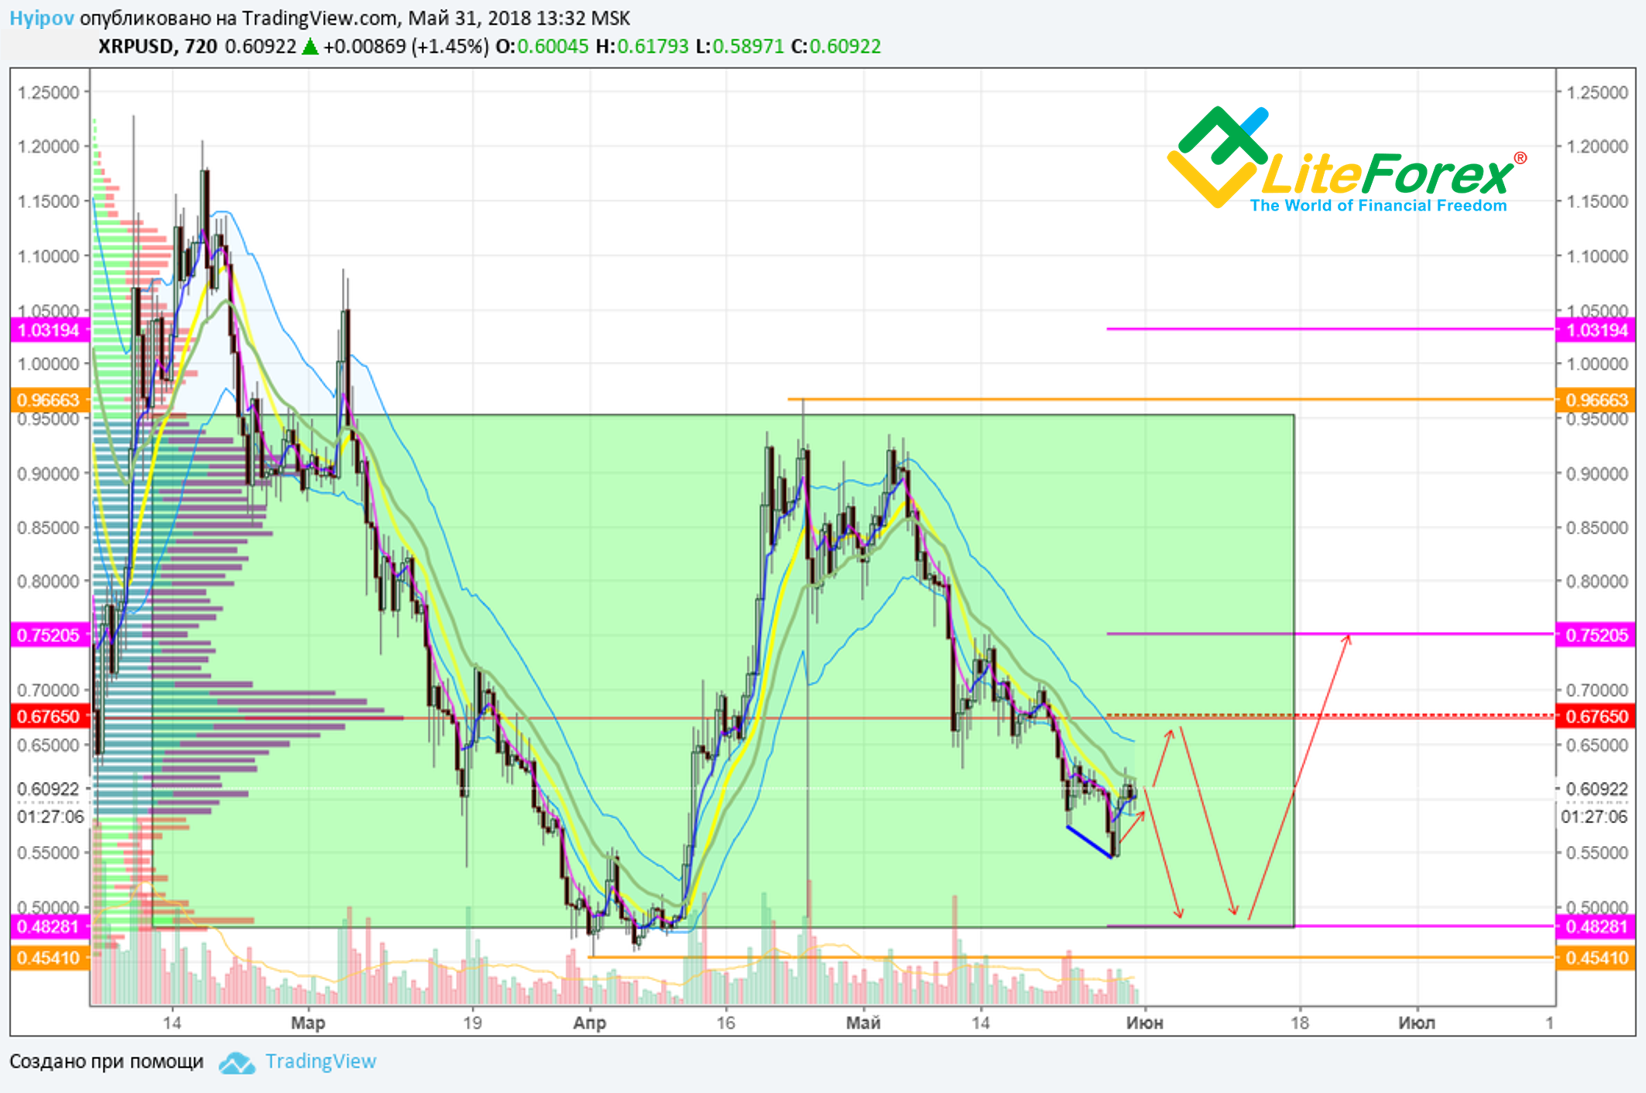
I suggested the low for XRP/USD be at about 0.50-0.46 (see the forecast above).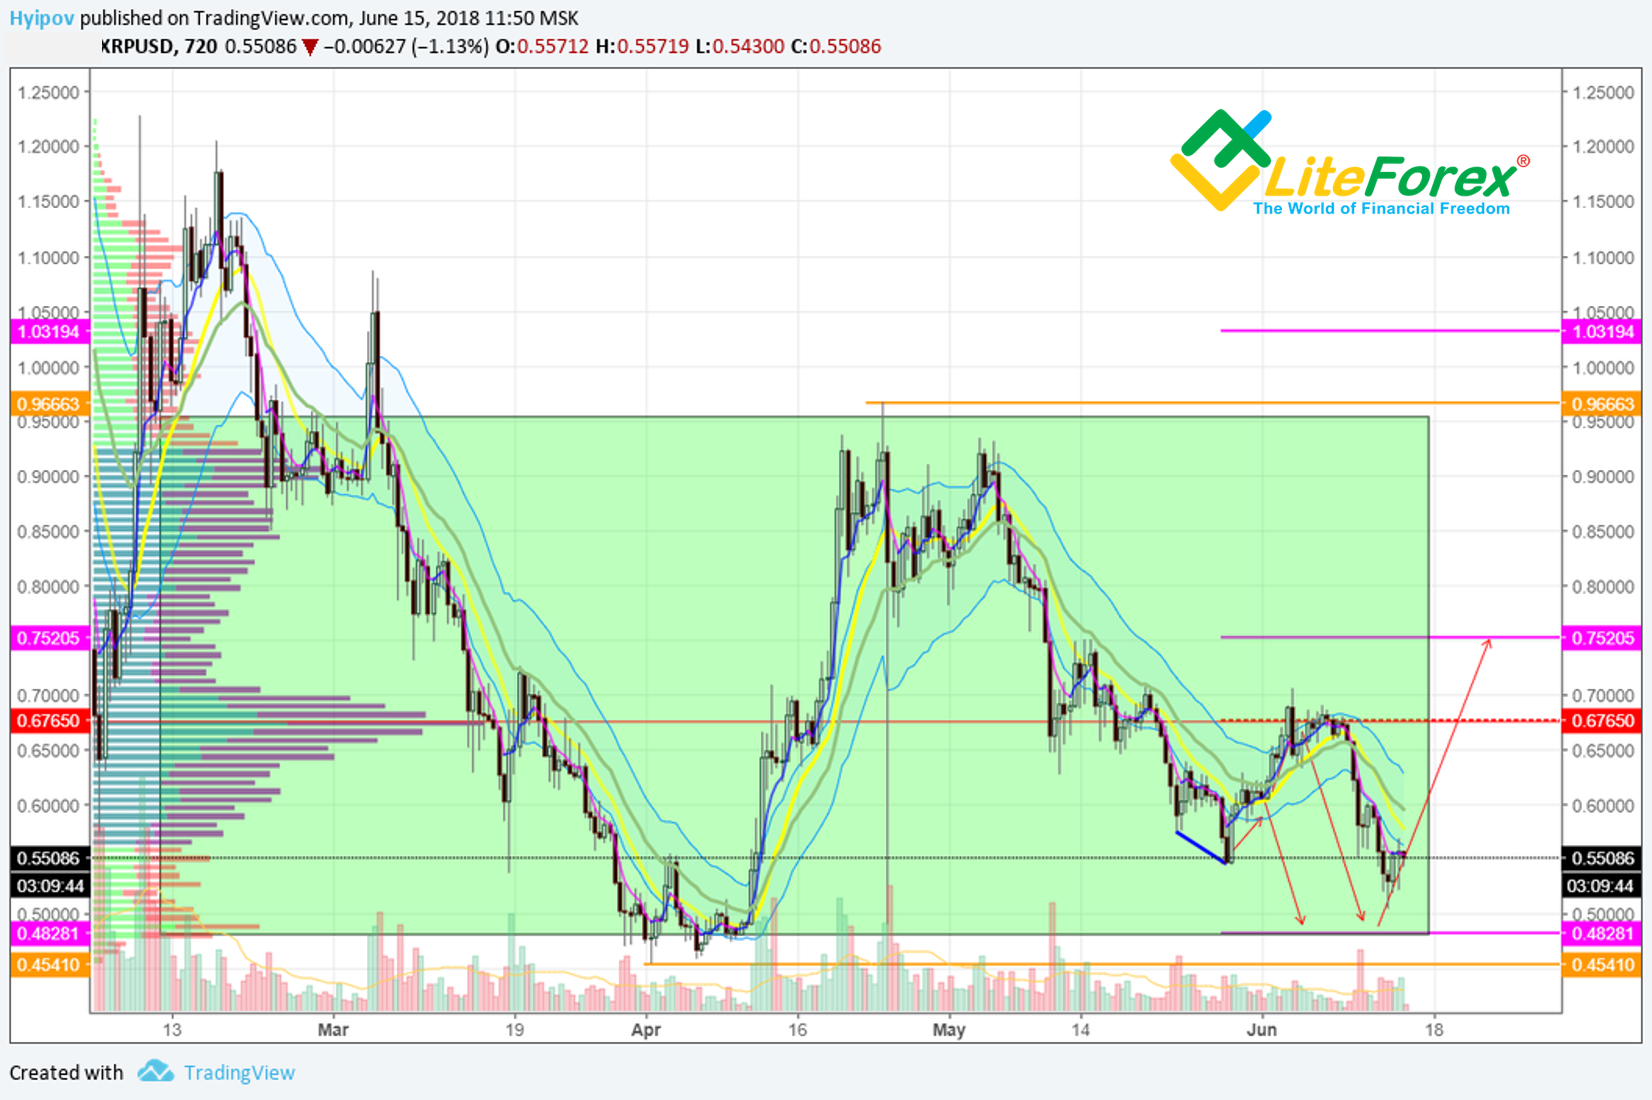
Finally, the ticker has reached the levels marked and is now going to move up.
Whether it will continue to rise, as I marked with the red arrow in my previous forecast, greatly depends on Bitcoin.
Now, to make the prediction more objective, we need to update the current key levels for XRP/USD.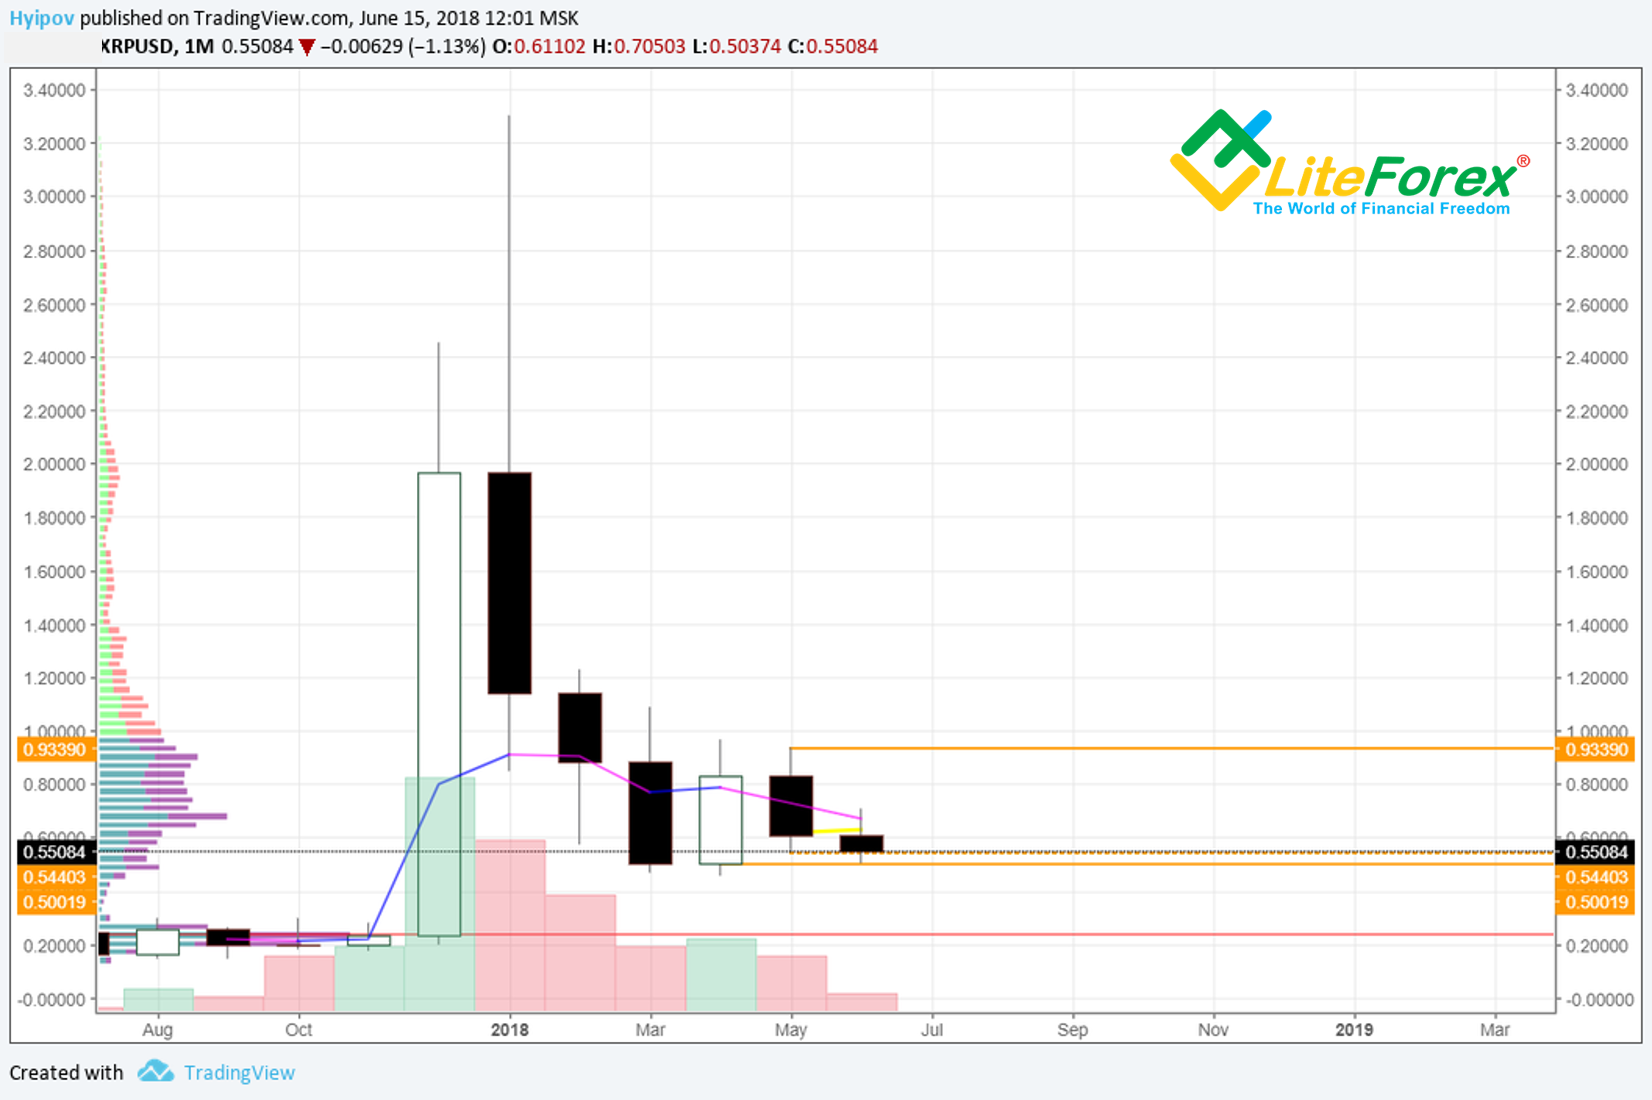
In the monthly timeframe, little has changed in the key levels.
We only need to mark the broken out May’s low at 0.54. Now, it is not so strong, so I marked it with dots. But April’s close is strong, so I marked it with the orange solid line.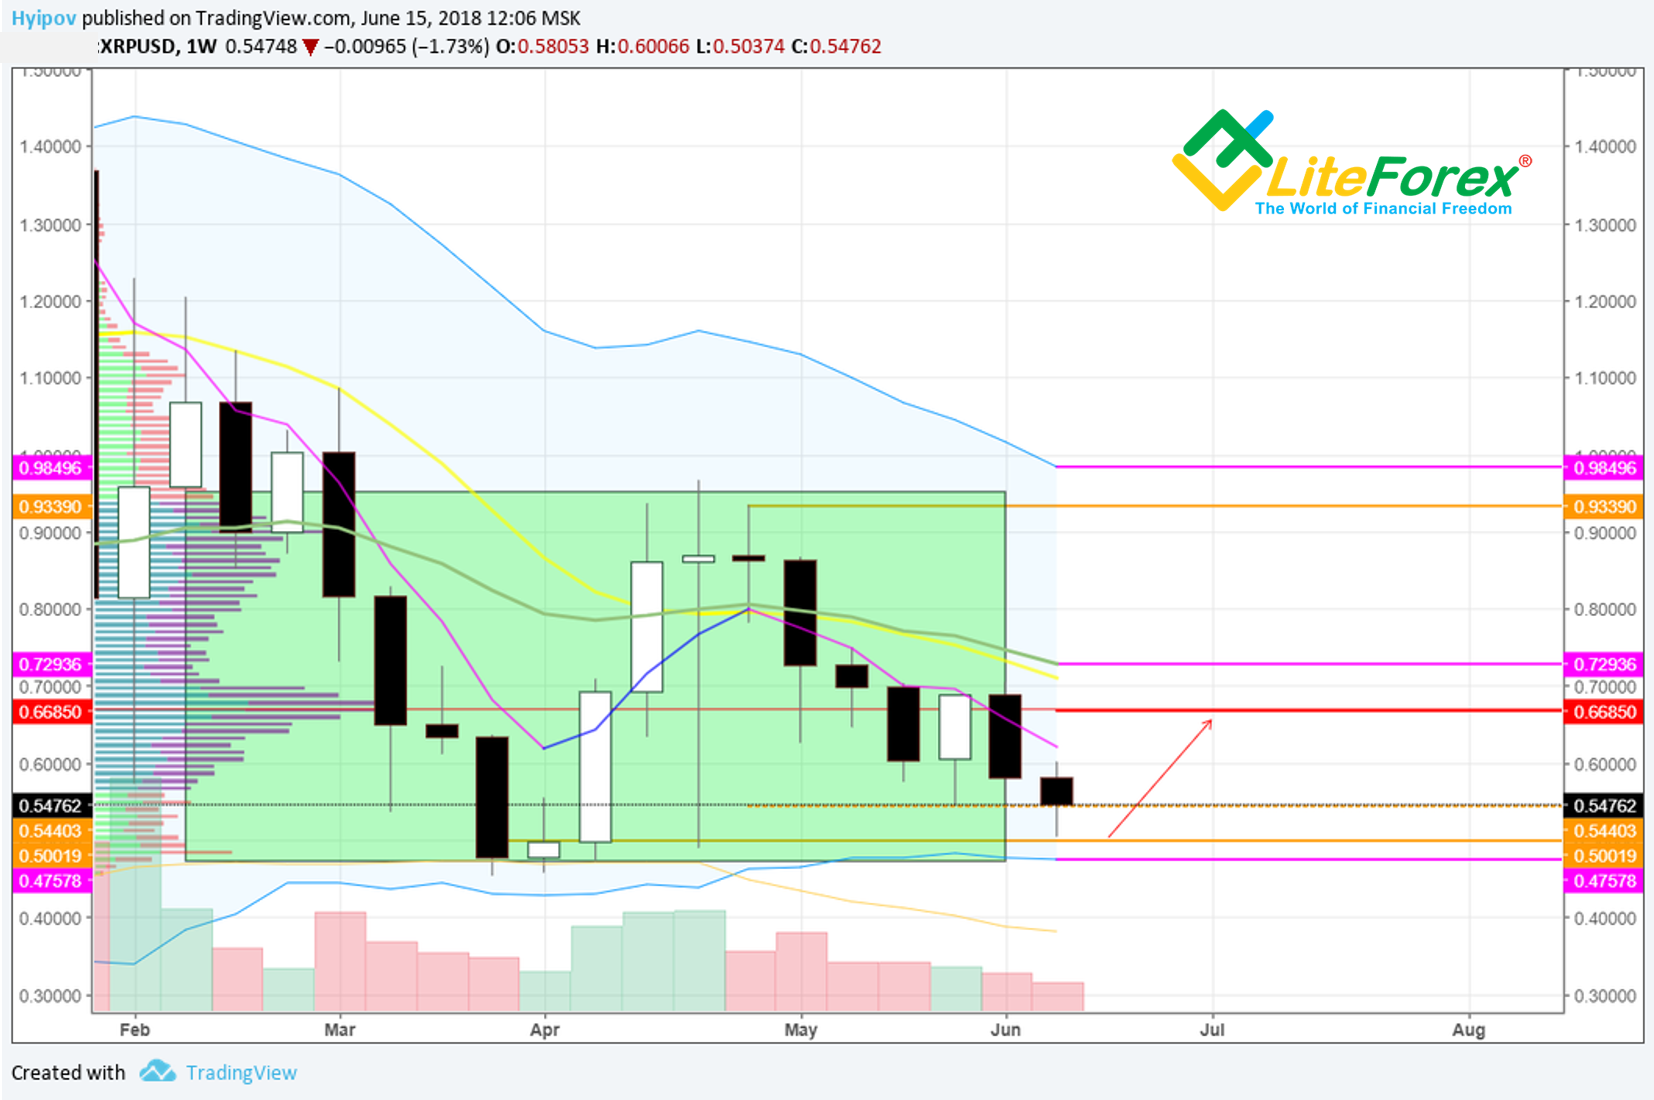
In the weekly timeframe, the ticker is trading inside the channel (the green box in the chart above).
As I’ve said above, the ticker rebounded from the support at 0.50, and so, according to BTCUSD moves, we can expect bullish correction.
The next target for this price move will be the check point at 0.66 USD, marked with the red line.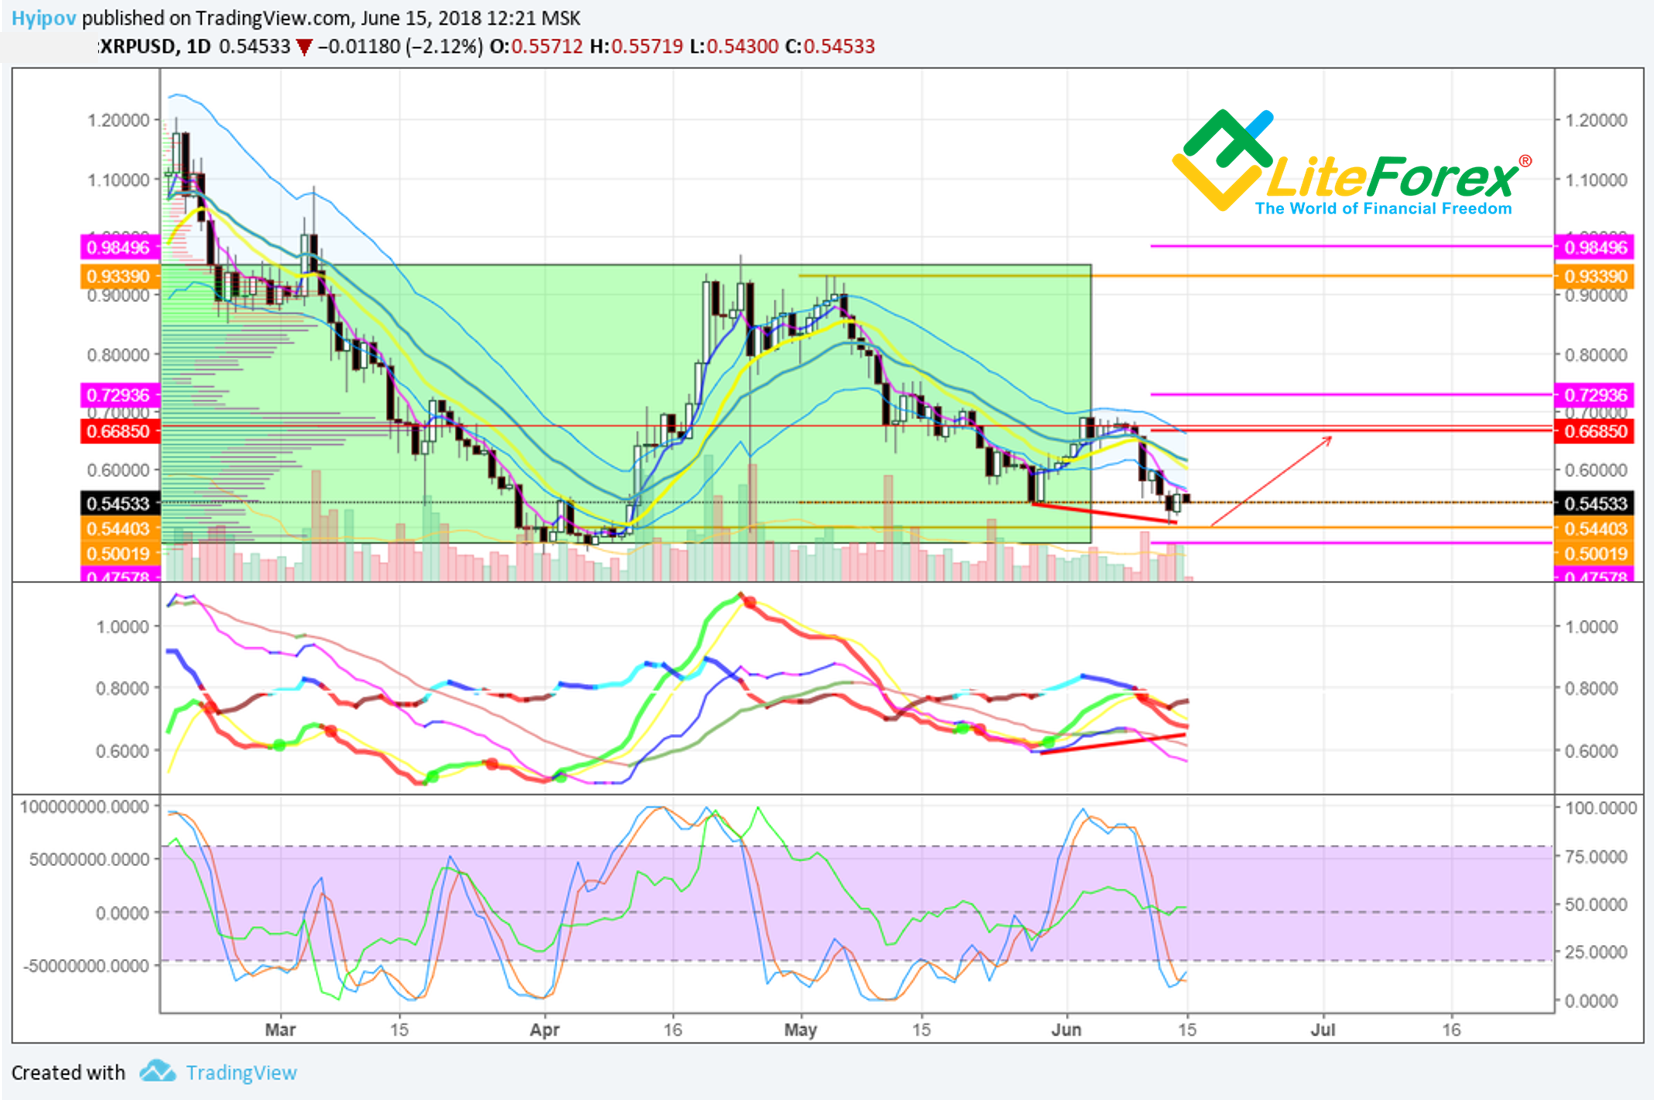
In the daily timeframe, the market looks bullish.
The main buy signals here are MACD bullish convergence and RSI stochastic that entered the oversold zone and has already reversed there, it is now directed upwards.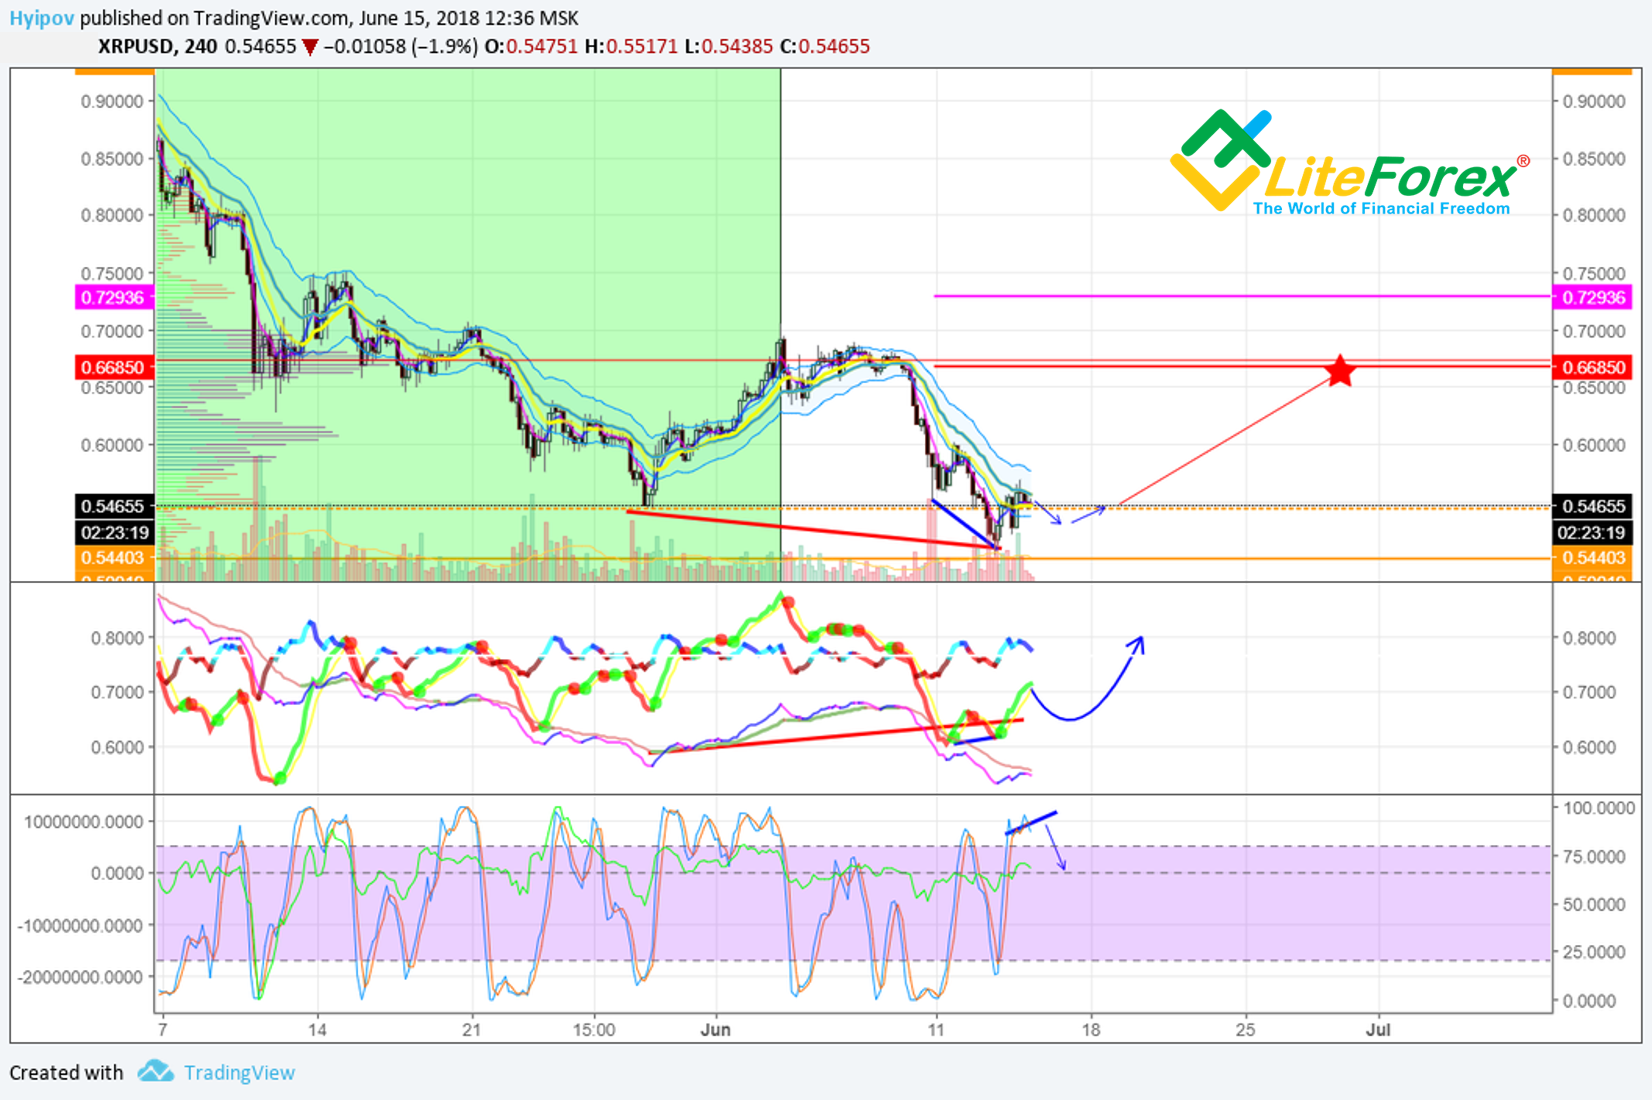
In four-hour chart, there is local bullish convergence (marked with the blue line in the chart above). In addition, RSI stochastic indicates strong overbought, which suggests a possible rollback in future.
MACD is going up, towards the indicator window top border. In this situation, its moving averages are unlikely to go down below the previous low.
The scenario, which meets the forecasts of all indicators, can develop only if the price is trading flat.
Summary
XRP/USD closely correlates to BTC/USD and follows the pair, slightly deviating.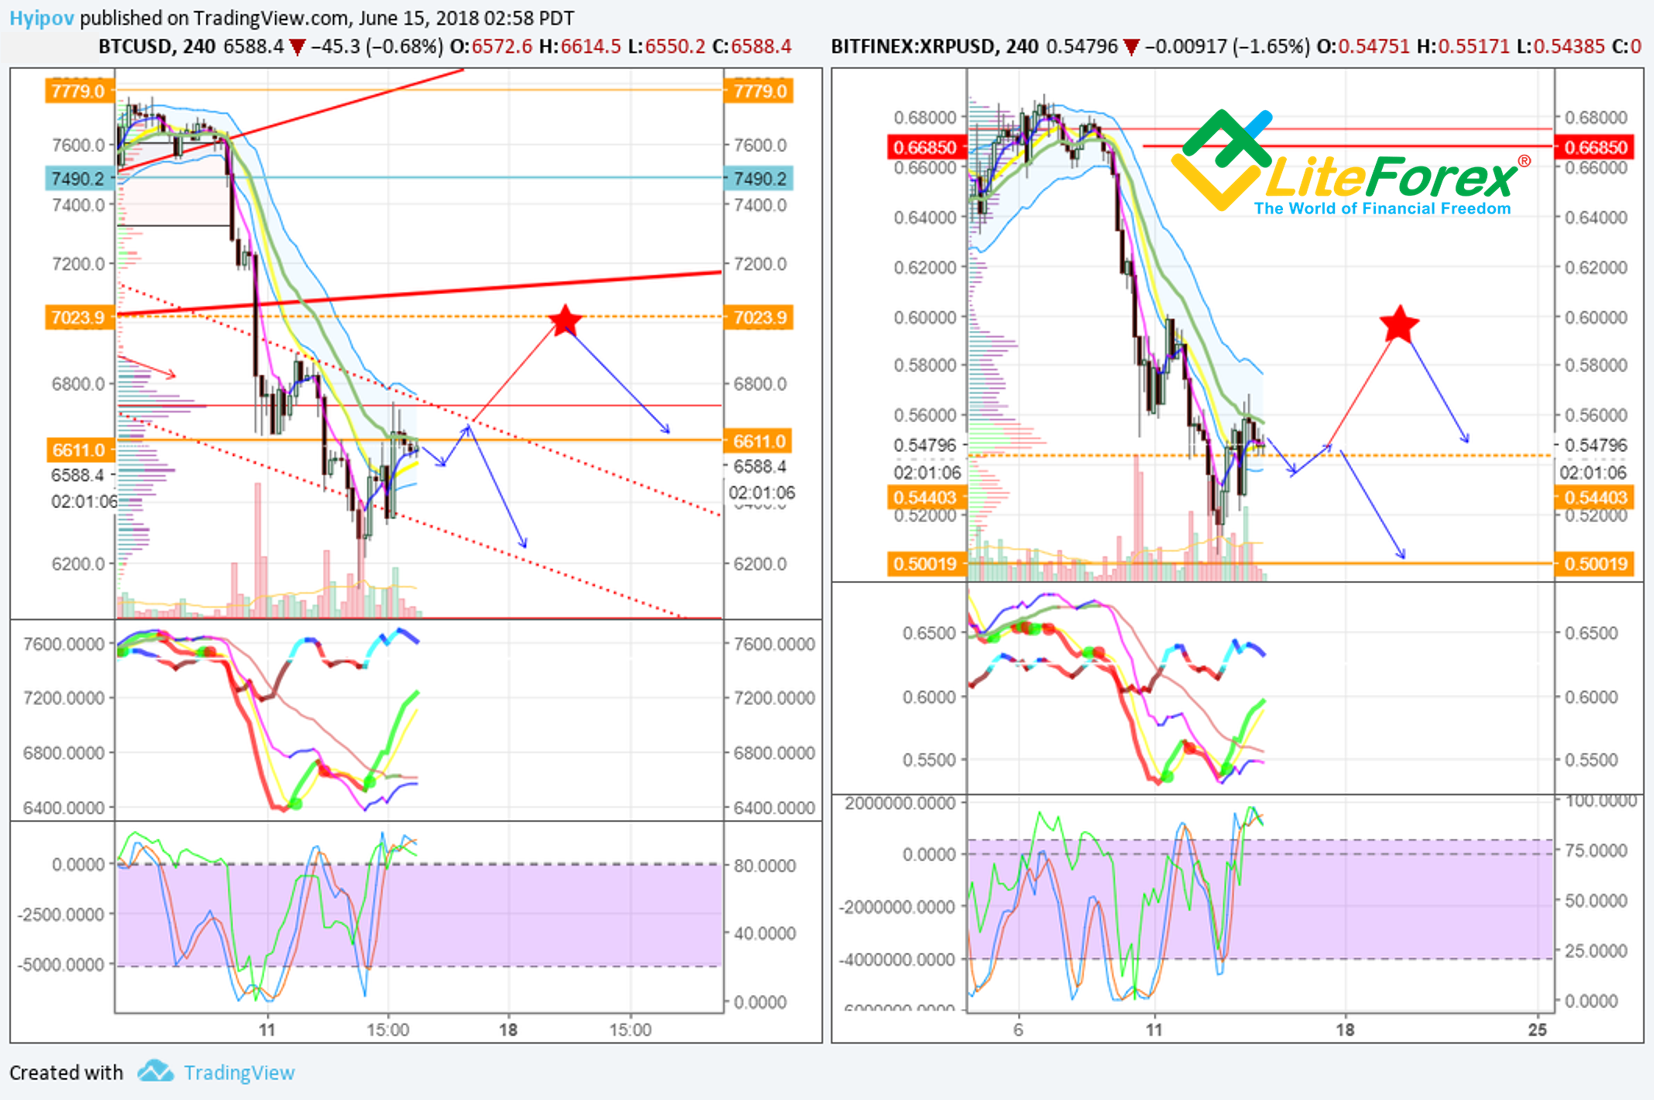
Ripple features the will to rise, but Bitcoin will allow it only provided that it goes up towards 7000 USD, which, in the present context, can hardly occur.
Bitcoin is likely to test the current low. If so, I expect XRP to follow it. After trading flat for a while, it could try to reach 0.50 USD.
I should note that, just yesterday, Ripple coin image was rebranded. Now, instead of XRP blue spinner, the new logo will look like the fragmented letter “X” with a rounding in the center. It is hard to say how the rebrand will affect the XRP rate; however, the event is likely to draw some extra attention.
