
We have been highlighting several market indicators trading at critical time/price areas over the past month or so.
And today is no different as we take a look at the Advance/Decline Line for NYSE common stocks.
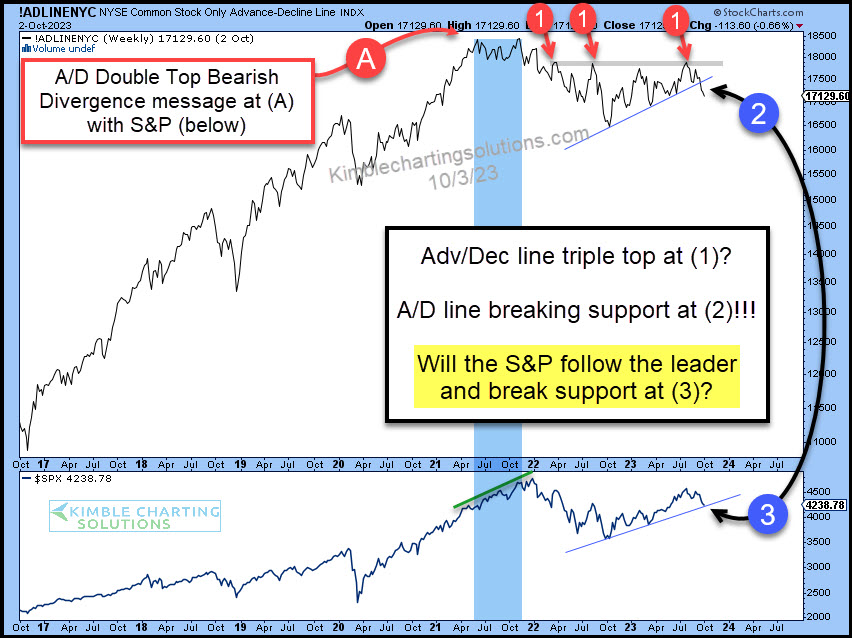
This is a very important measure of market breadth looking at the number of advancing versus declining stocks each day.
As you can see in the chart below, the Advance/Decline Line (A/D Line) created a double top (blue shade) before creating a triple top at (1). And now it is breaking down below support at (2). Yikes!
Looking at the lower pane in the chart, I humbly ask, “will the S&P 500 follow the leading indicator and break support at (3)???
Could the A/D Line be sending a new message to the markets with its breakdown at (2)? Stay tuned.
Which stock should you buy in your very next trade?
AI computing powers are changing the stock market. Investing.com's ProPicks AI includes 6 winning stock portfolios chosen by our advanced AI. In 2024 alone, ProPicks AI identified 2 stocks that surged over 150%, 4 additional stocks that leaped over 30%, and 3 more that climbed over 25%. Which stock will be the next to soar?
Unlock ProPicks AI