Technical analysis is about many things. It is about finding prior battleground price levels that may determine support and resistance. It is about identifying reversals in price. But first and foremost it is about identifying trends. The simplest definition of a trend in stock prices can be made by looking at highs and lows in fluctuation of price. A series of higher highs followed by higher lows would define a trend to the upside.
Technicians practice their craft on many timeframe with the general though that the longer the timeframe the more significant the price action is. It is less often acknowledged that the lower (shorter) timeframes can be very useful in identifying trends that may continue to the higher level. That is, it takes a nascent short term trend to build into a longer term trend. Herein lies the value of a longer term trader looking at shorter term price action.
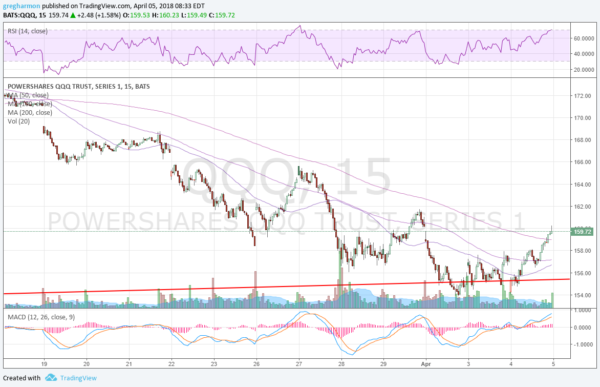
 The chart above in the NASDAQ 100 ETF, QQQ, is one to watch for a potential change of character and a new tend formation on this smaller scale. It is a chart of 15 minute price action. The solid red line marks rising trend support on the daily price action that has been in place since April last year. A slight break on the smaller scale is interesting. But what I am looking at now is the move higher Wednesday.
This move brought the price over the 200 period SMA for the first time since March 16th. It was also the first peak in the last 4 to break this level. With the pre-market action Thursday showing follow through the next interesting price level is the March 29 peak at 161.71. A push over that would make for a first higher high. As I write the price is less than 50 cents away. keep an eye here in the short term to see how it may carry over to the longer term.
The information in this blog post represents my own opinions and does not contain a recommendation for any particular security or investment. I or my affiliates may hold positions or other interests in securities mentioned in the Blog, please see my Disclaimer page for my full disclaimer.
Which stock should you buy in your very next trade?
With valuations skyrocketing in 2024, many investors are uneasy putting more money into stocks. Unsure where to invest next? Get access to our proven portfolios and discover high-potential opportunities.
In 2024 alone, ProPicks AI identified 2 stocks that surged over 150%, 4 additional stocks that leaped over 30%, and 3 more that climbed over 25%. That's an impressive track record.
With portfolios tailored for Dow stocks, S&P stocks, Tech stocks, and Mid Cap stocks, you can explore various wealth-building strategies.
