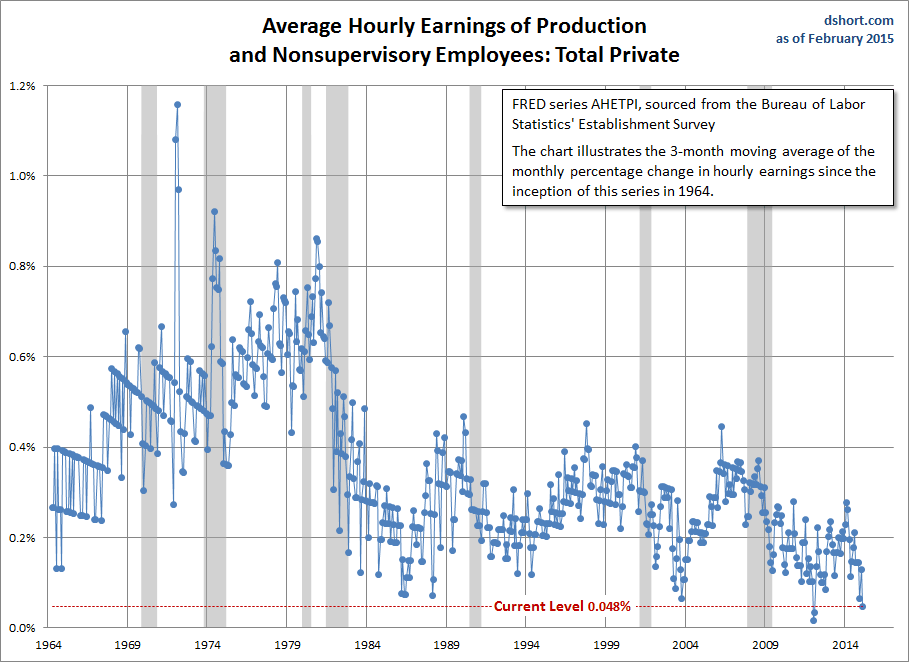
Over the weekend, my virtual friend and occasional correspondent New Deal Democrat requested some assistance on visualizing Average Hourly Earnings of Production and Nonsupervisory Employees: Total Private, a series produced by the Bureau of Labor Statistics and conveniently published in the FRED repository. Here is his request and initial observations:
"Would you please prepare a graph of the 3 month moving average of series AHETPI, wages for nonsupervisory personnel, going all the way back to the beginning of the series, and mark a line at its current reading, which if my math is correct is +.049%. If I've done my math correctly, the only other times the reading was lower since the series began in the 1960s, was Nov 2011-Jan 2012, and Dec 2011-Feb 2012."
Here is the Excel chart created in response to NDD's request. As NDD correctly pointed out, the latest data point is the lowest in this series with the exception of two monthly averages about three years ago.

For NDD's analysis, along with several other graphs, see his article:
Which stock should you buy in your very next trade?
With valuations skyrocketing in 2024, many investors are uneasy putting more money into stocks. Unsure where to invest next? Get access to our proven portfolios and discover high-potential opportunities.
In 2024 alone, ProPicks AI identified 2 stocks that surged over 150%, 4 additional stocks that leaped over 30%, and 3 more that climbed over 25%. That's an impressive track record.
With portfolios tailored for Dow stocks, S&P stocks, Tech stocks, and Mid Cap stocks, you can explore various wealth-building strategies.
