Trump diagnosed with chronic venous insufficiency, remains healthy
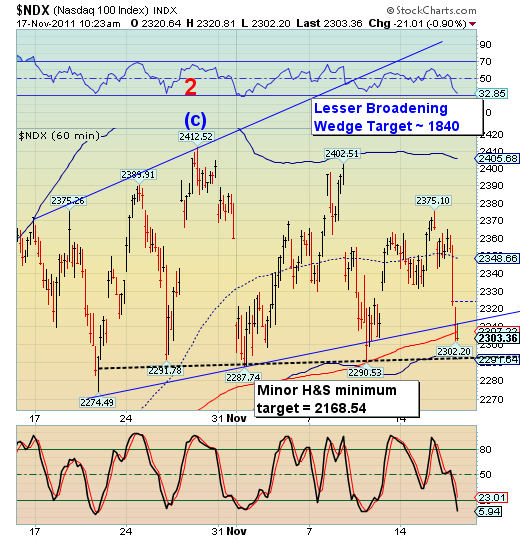
The Head & Shoulders targets usually run the gamut between 1.5X to 2.62X the length of wave one. The minimum target annotated in the chart is 1.87X. In the first wave down ending in August, wave three was 2.75 times the length of wave one, so that may set a minimum standard in fractal relationships. If a panic selloff occurs, it appears that the next wave could be as large as 4.5X the length of wave one (the Broadening Wedge target). That is why I am annotating both targets. The reality may be somewhere in between, but I wish to inform you of the range of probabilities for this decline.

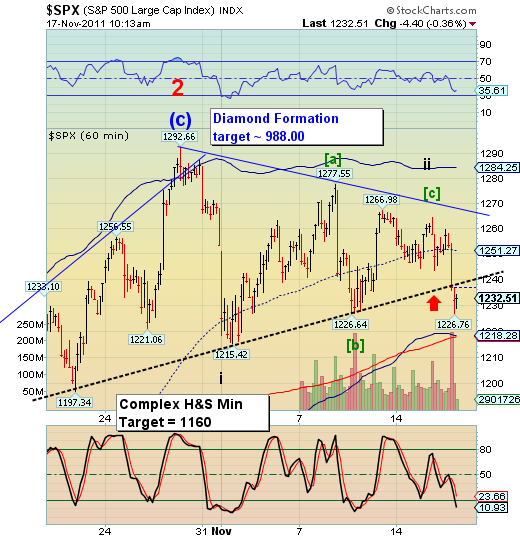
The SPX is getting a little "buy the dip" action at 1226.00. You can see where that comes from on the chart since traders often will put buy orders at the previous low. This won't last, because a retest of the neckline/Diamond Formation trendline is likely to send the SPX much lower. However, the powers that be may use this bounce simply to buy time until trading closes on index options at noon today. This will trap the options sellers if the market continues its decline later in the afternoon.
It is possible that the big-money may try to keep the market afloat until Friday morning, when the index options are settled.

Which stock should you buy in your very next trade?
With valuations skyrocketing in 2024, many investors are uneasy putting more money into stocks. Unsure where to invest next? Get access to our proven portfolios and discover high-potential opportunities.
In 2024 alone, ProPicks AI identified 2 stocks that surged over 150%, 4 additional stocks that leaped over 30%, and 3 more that climbed over 25%. That's an impressive track record.
With portfolios tailored for Dow stocks, S&P stocks, Tech stocks, and Mid Cap stocks, you can explore various wealth-building strategies.
