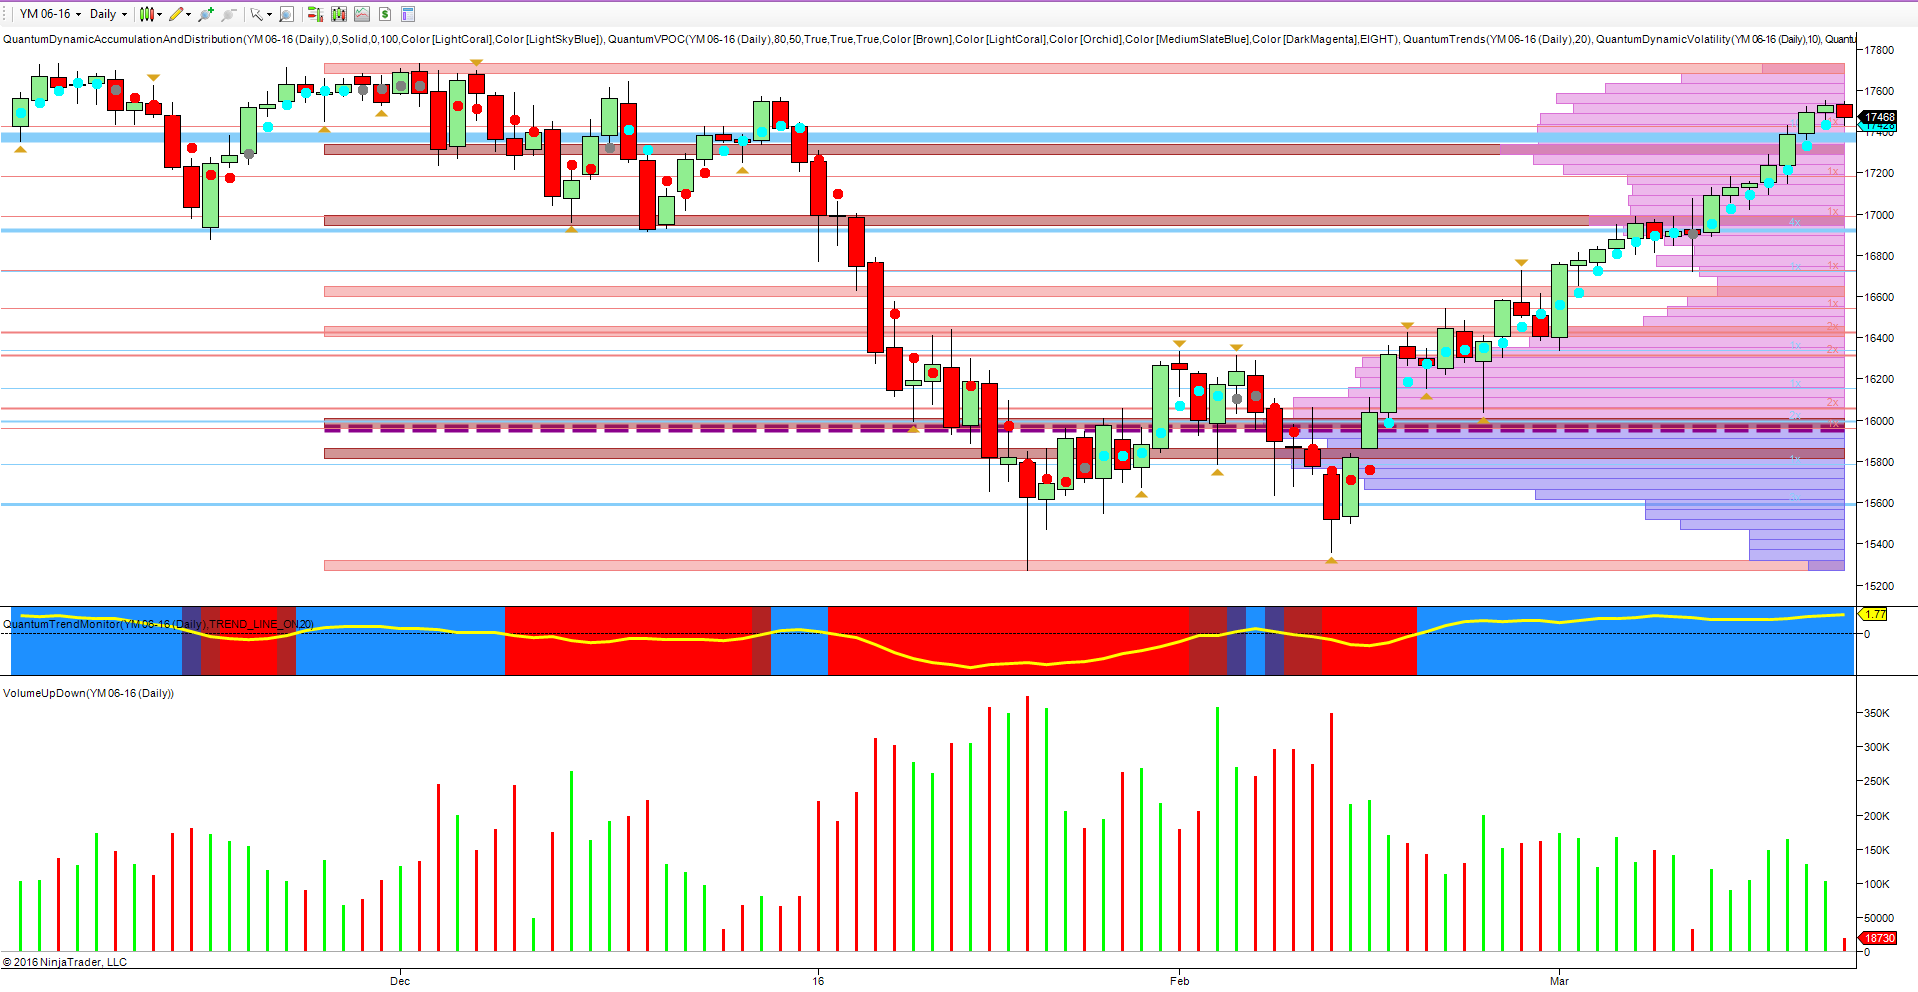
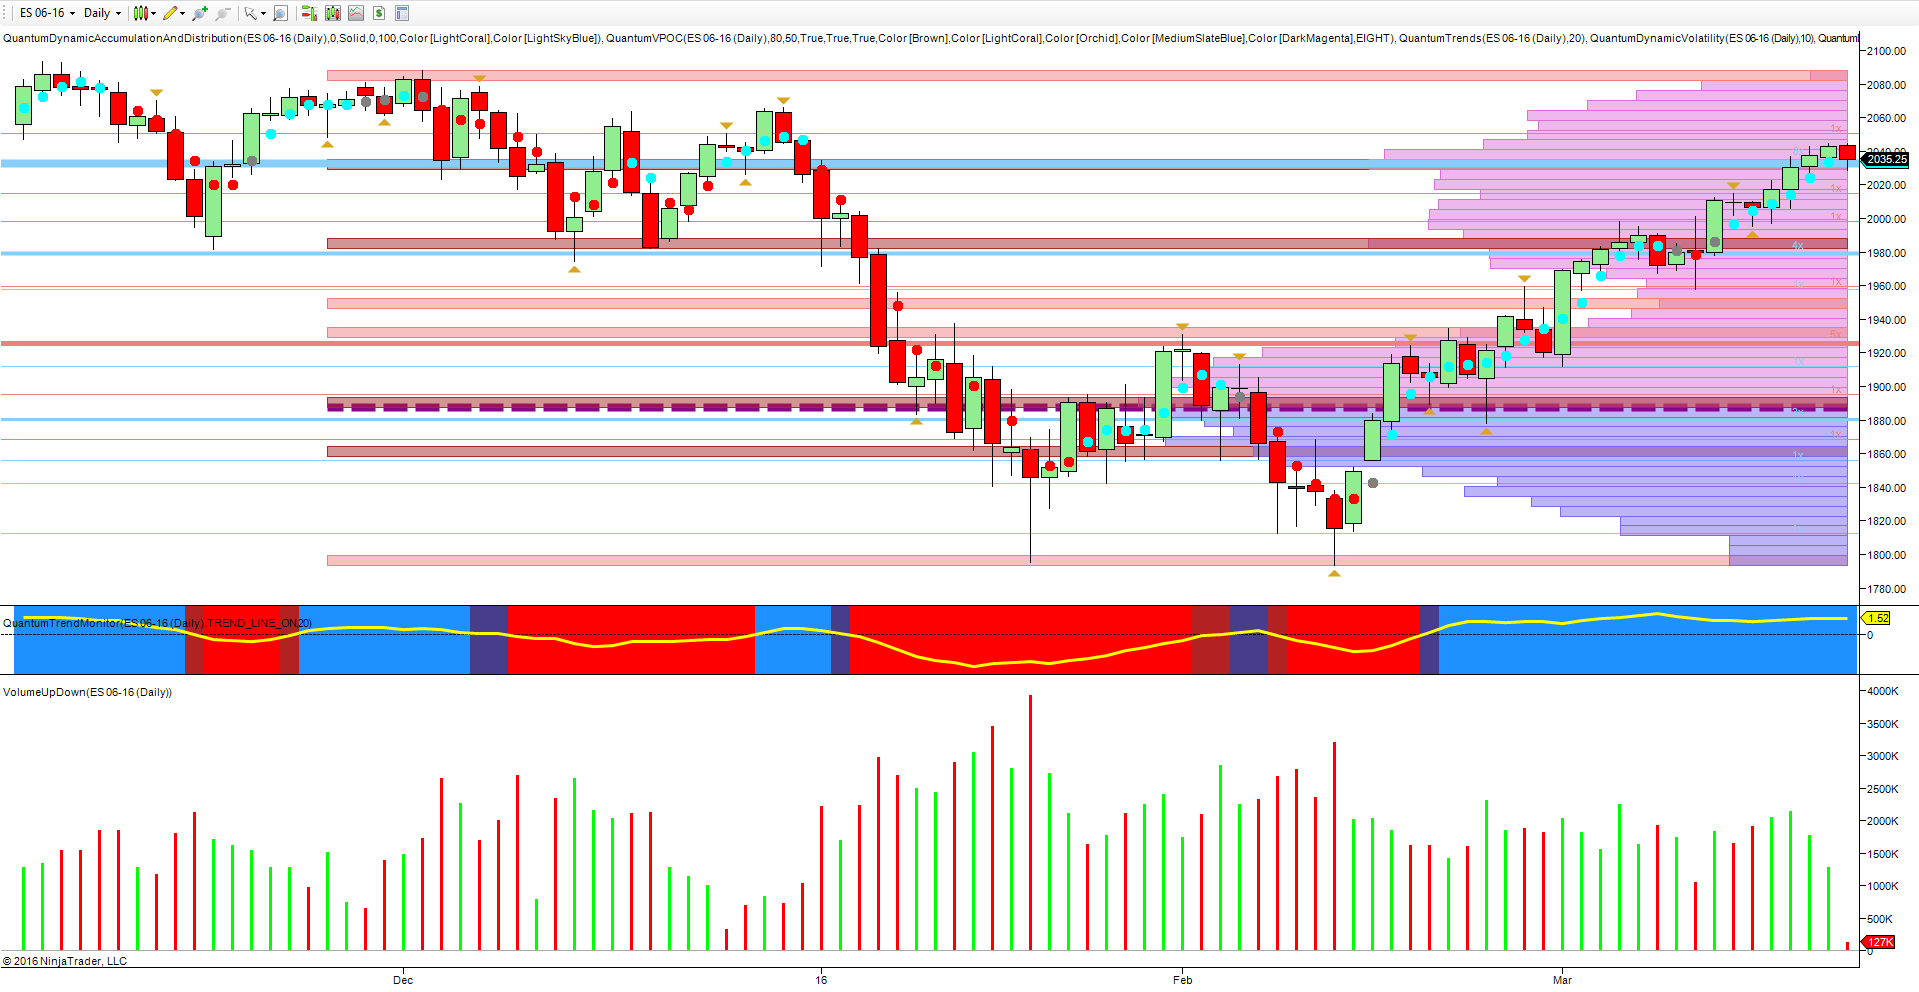
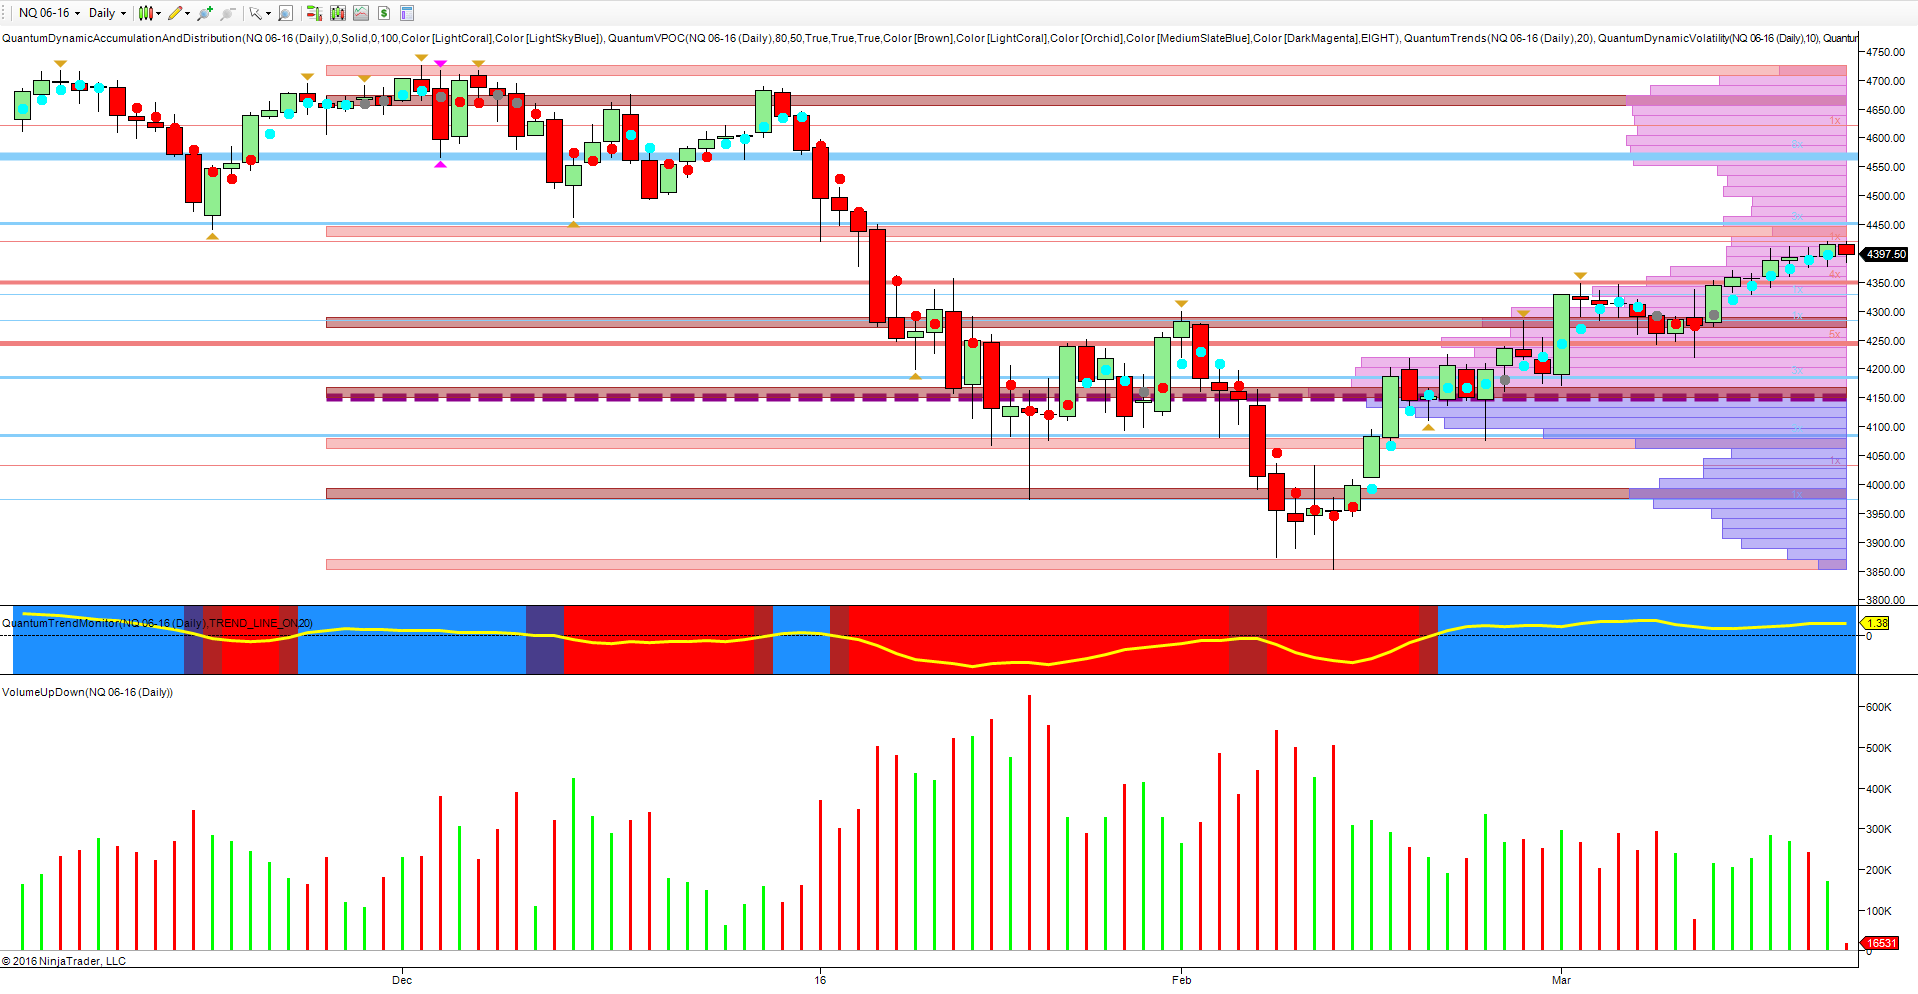
As we move towards the end of the first quarter of the new year, it is interesting to consider one of the more subtle changes to the principle US indices that appears to have passed by unnoticed, and yet perhaps is signalling a deeper seated issue as to the ‘recovery’ in the US economy much vaunted by the FOMC. And the daily charts for the NQ, the YM and the ES is where this subtle change appears most vividly.
Throughout much of 2015, it was the NQ emini that was leading the other indices higher, with strong moves in this index then dragging the others higher either during the session or some days later. The NQ emini was the leader of the pack with the YM and ES the laggards, and no doubt premised on the fact that the US economy was moving out of recession and into early expansion with technology stocks leading the recovery. Since the start of the year this dynamic has changed, with the NQ now following whilst the ES and YM lead, and the daily charts for all three express this very clearly.
If we start with the YM emini, here the price action has recovered from the lows of late January and early February which saw the stopping volume arrive, and a consequent move higher with the index now penetrating deep into the extended congestion phase of last year in the 17,000 to 17,800 area.
This was one of the longest congestions periods ever witnessed for the primary markets, and as such developed an immensely strong region of price resistance for any longer term bullish trend to develop. For the YM, we are now deep within this area with the ceiling now beckoning once more.
Moving to the ES emini, once again we have a similar picture here which mirrors the price action on the YM. For the ES too is now deep in the congestion area between 1980 and 2080 and attempting to push through the current resistance in the 2035 region.
Finally to the NQ itself, and here we see a very different picture. Whilst the index has recovered, the level of the recovery is substantially below the other two indices, and indeed it has yet to test the resistance region at 4450 which marks the lower level of the congestion phases now breached by the other two. Is this significant? Perhaps as it may be a sign that the recovery in the US economy is not quite as rosy as the FED would suggest.
Which stock should you buy in your very next trade?
With valuations skyrocketing in 2024, many investors are uneasy putting more money into stocks. Unsure where to invest next? Get access to our proven portfolios and discover high-potential opportunities.
In 2024 alone, ProPicks AI identified 2 stocks that surged over 150%, 4 additional stocks that leaped over 30%, and 3 more that climbed over 25%. That's an impressive track record.
With portfolios tailored for Dow stocks, S&P stocks, Tech stocks, and Mid Cap stocks, you can explore various wealth-building strategies.


