Nvidia shares jump after resuming H20 sales in China, announcing new processor
The Philadelphia Semiconductor Index, SOX, is sending off some mixed signals this week. You now that pair of black socks you have that may have gotten bleached a little bit on one sock, so it seems they do not match. The daily and weekly charts look like that. Take a look.
The weekly chart below shows the Index completing a ‘W’ and then continuing higher. It tagged trend support a couple of times, once in April and then again last month and now is heading back higher. As it rises towards resistance from the previous high the Relative Strength Index (RSI) is turning back higher and the Moving Average Convergence Divergence indicator (MACD) is improving towards a bullish cross. Things are looking up on this timeframe.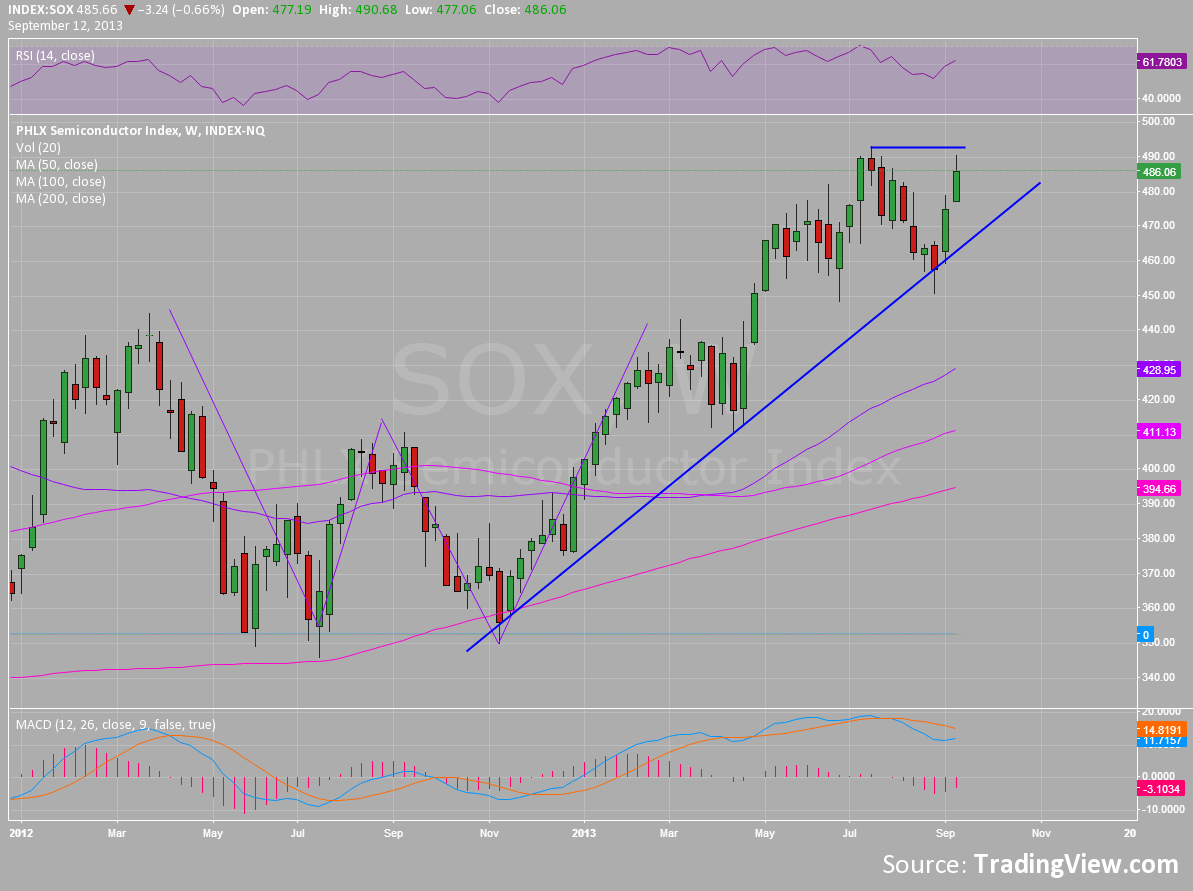
But what about the daily chart? That shows a Double Bottom launching it higher, but as it is approaching resistance the RSI is rolling lower. The histogram on the MACD is also starting to move down and the MACD line leveling. Maybe topping?
But the three candlesticks in the yellow box may be the key to whether this pair of SOX charts turns out to be mismatched or not. The green Marubozu gapping higher, was followed by a bearish Harami. That Harami is also a 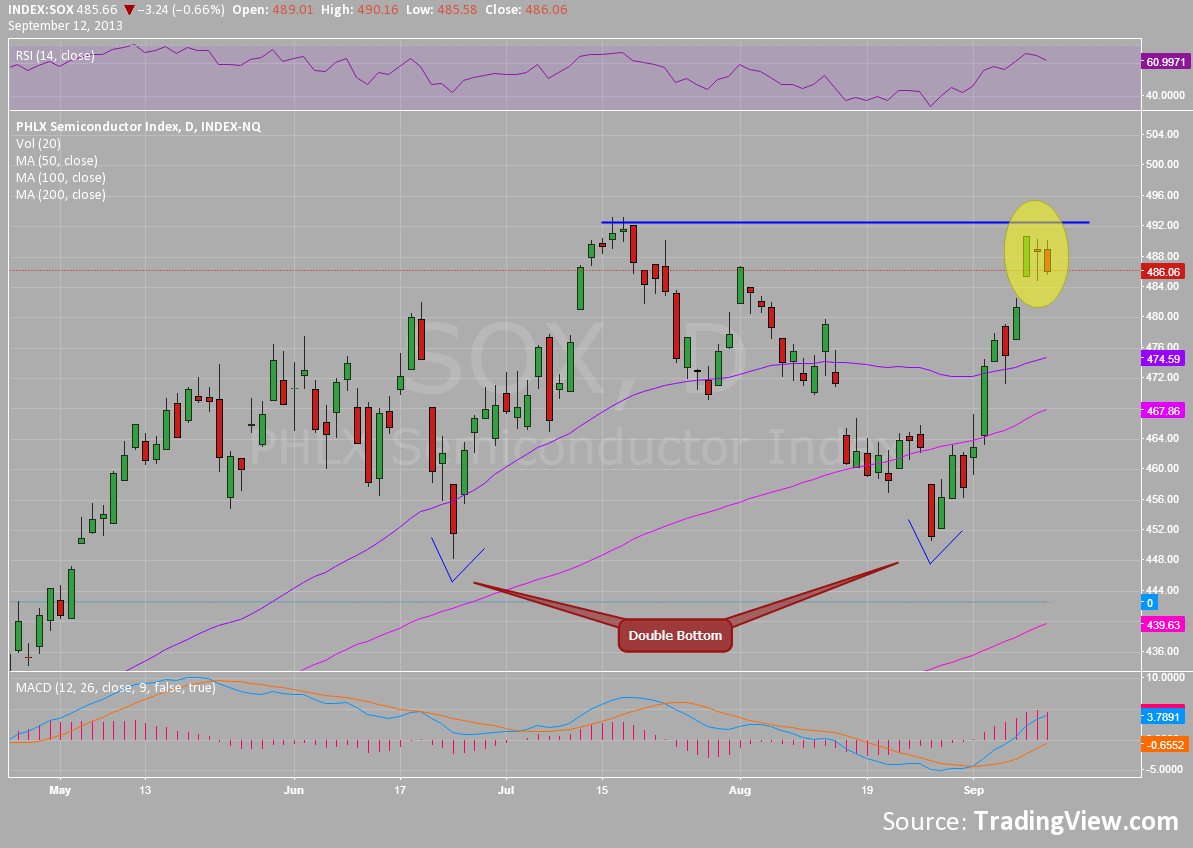
Hanging Man Doji, another potential reversal candle. Both were then confirmed lower with a red candle Thursday. Should this continue lower Friday this pair of SOX looks to remain mismatched with a retest of the 470 area. A move back over 490 would force you to take another look and see if they are really matched and all headed higher.
Disclosure: The information in this blog post represents my own opinions and does not contain a recommendation for any particular security or investment. I or my affiliates may hold positions or other interests in securities mentioned in the Blog, please see my Disclaimer page for my full disclaimer.
Original post