A year end series taking a longer perspective in many market indexes, macro related commodities, currency and bonds. Over three weeks these reviews are intended to help create a high level road map for the the next twelve months and beyond. We continue with The Japanese Nikkei (NKY, EWJ).
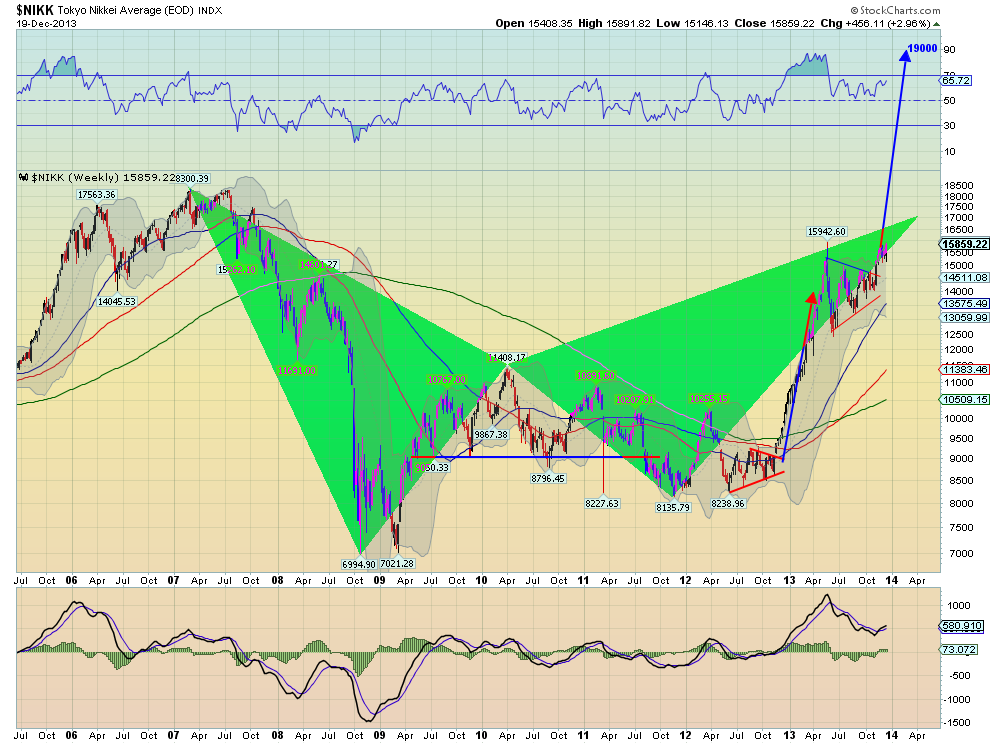
The Japanese Nikkei Average (NKY, EWJ) has been asleep for years until recently. With the new monetary policy targeting a weaker Yen the stock market has taken flight. The monthly chart below shows that it has moved back to a 18 year falling resistance line, The price action looks strong but the momentum indicators are getting a bit elevated. A break of the trend line would signal a very bullish market. A break would see resistance at the prior peaks at 18,300, 20,800 and 22,750. But there is a lot of work left for Abe and company to get through that resistance. Drilling into the weekly chart shows that there is reason to believe a break above 16,000 is in the cards. There are two patterns playing out in the
Average. The bigger one is the bearish Bat harmonic (green triangles) that targets 17,000 above before a reversal. And that assumes it does not morph into a Crab with a potential reversal zone at 25,300. The second pattern is the Measured Move higher, comparable to the move out of the triangle at 9,000 which targets 19,000. The break out of the consolidation in November in the symmetrical triangle higher targets about 17,200, and it is consolidating half way there. This view looks promising for more upside and the current consolidation is just what it needs to work off the overbought condition on the 
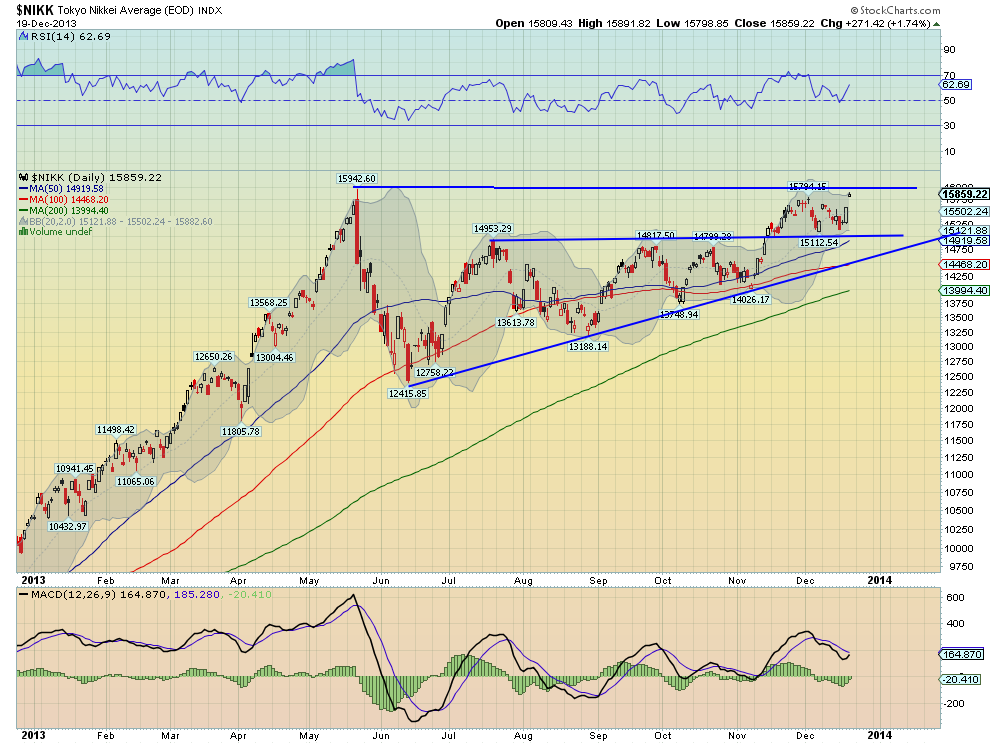
monthly chart. And a visit to the daily chart shows that 16,000 is the key to getting it all started. A break out of an ascending triangle in November has been consolidating between 15,000 and 16,000 since and approaching the top bound. A break first targets 17,000 and then 17,600 before 19,600. So the party gets started over 16,000 and has key levels at 17,000-17,200 followed by 17,600 and 18,300. From there look for 19,000 and 19,600 to give it pause before an assault on 20,800 and 22,750. Far from certain but biased tot he upside in all timeframes.
Disclaimer: The information in this blog post represents my own opinions and does not contain a recommendation for any particular security or investment. I or my affiliates may hold positions or other interests in securities mentioned in the Blog, please see my Disclaimer page for my full disclaimer.
Original post
Which stock should you buy in your very next trade?
AI computing powers are changing the stock market. Investing.com's ProPicks AI includes 6 winning stock portfolios chosen by our advanced AI. In 2024 alone, ProPicks AI identified 2 stocks that surged over 150%, 4 additional stocks that leaped over 30%, and 3 more that climbed over 25%. Which stock will be the next to soar?
Unlock ProPicks AI