Stock market today: S&P 500 in weekly loss as trade war fears intensifyy
The first thing that comes to mind when someone mentions the Nasdaq 100 (NDX), (QQQ), is the crash of 2000, even if you are only in your twenties you are constantly reminded of how high valuations got and how quickly it all came crashing down. Since then, though, it has been moving slowly and steadily higher, with the exception of the period around the 2008-2009 financial crisis.
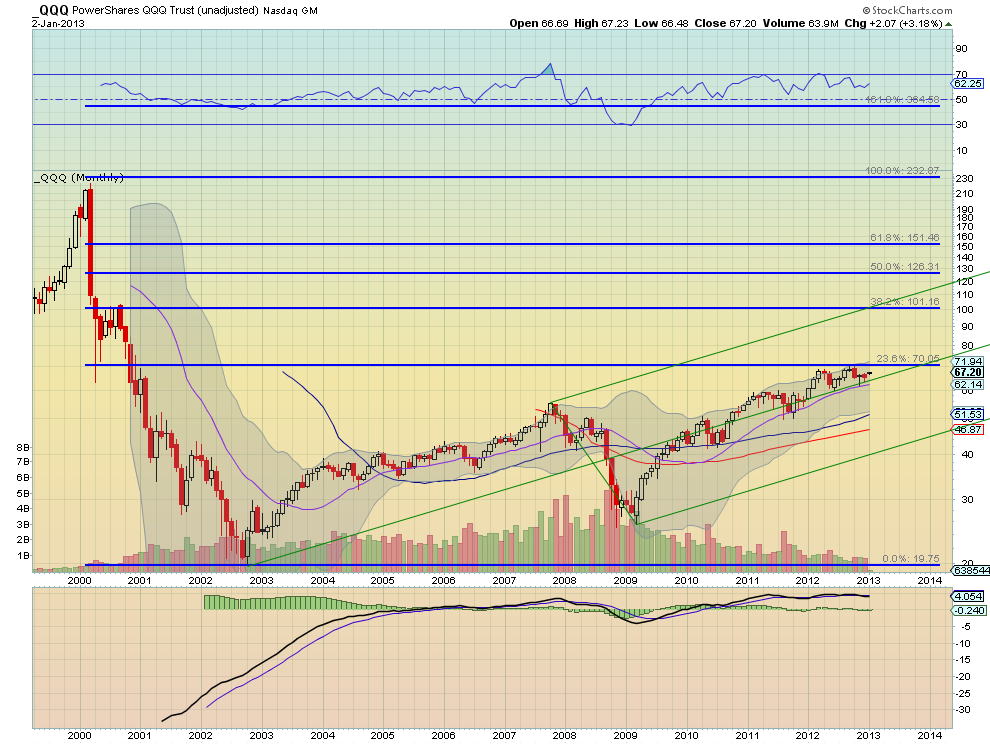
The monthly chart below shows the recent pause happening at the 23.6% Fibonacci retracement of the crash move lower. It is also at the Measured Move comparable to the run off the bottom to the 2007 top, near 66. A natural place for some resistance. It is being wedged in by the Median Line of the bullish Pitchfork which is carrying it higher, paralleling the 20-month Simple Moving Average (SMA).
A glance at the Relative Strength Index (RSI) shows that it is bullish and has been holding over 60. On this longer timeframe this looks very bullish with the next real resistance at 82 and then 101. Zooming in the weekly picture shows those signs of consolidation or trouble a bit more clearly.
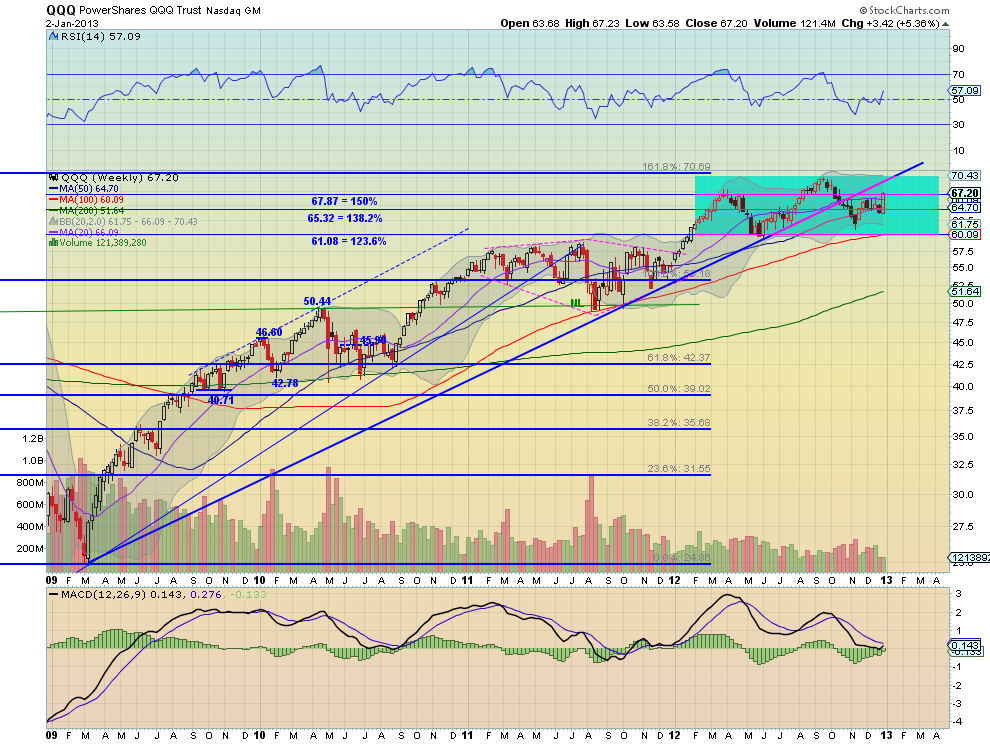
The rising trend since the 2009 low was only recently broken and a sideways range has been playing out since the beginning of the year between the 123.6% and 161.8% Fibonacci extension of the retracement of the move lower during the financial crisis, between 61.08 and 70.69. The current swing looks higher with support from the rising RSI which held in bullish territory on the latest dip and the Moving Average Convergence Divergence indicator (MACD) that is crossing to positive. 
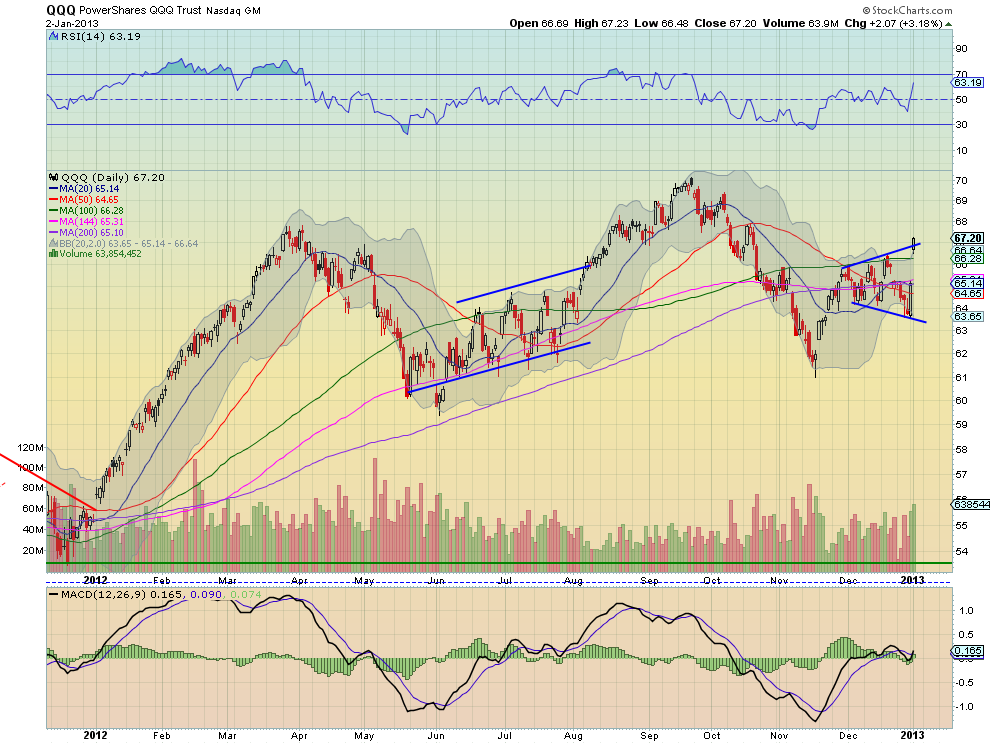
A move over 70.69 is required to turn this bullish longer term and out of neutral. Of course a drop under 60 would set the course lower. Zooming in one more time sees the daily chart building an expanding wedge around the SMA with Wednesday’s activity pushing through the top and over the 20-day SMA.
A continued hold of the close over the wedge at 67 and then move over 68 would seal the deal. And with a rising and bullish RSI and a MACD that is positive, it has support for more upside. So key levels to watch going forward are 67 and 68 on the short-term followed by 70.69 in the intermediate-term and finally 82 and 101 longer term. All bets are off on the upside on a break below 60.
Disclaimer: The information in this blog post represents my own opinions and does not contain a recommendation for any particular security or investment. I or my affiliates may hold positions or other interests in securities mentioned in the Blog, please see my Disclaimer page for my full disclaimer.
Original post
Which stock should you buy in your very next trade?
With valuations skyrocketing in 2024, many investors are uneasy putting more money into stocks. Unsure where to invest next? Get access to our proven portfolios and discover high-potential opportunities.
In 2024 alone, ProPicks AI identified 2 stocks that surged over 150%, 4 additional stocks that leaped over 30%, and 3 more that climbed over 25%. That's an impressive track record.
With portfolios tailored for Dow stocks, S&P stocks, Tech stocks, and Mid Cap stocks, you can explore various wealth-building strategies.
