Get 40% Off
⚠ Earnings Alert! Which stocks are poised to surge?
See the stocks on our ProPicks radar. These strategies gained 19.7% year-to-date.
Unlock full list

7 Bullish Insights From China’s Long-Term Stock Market Chart

Published 03/29/2017, 02:58 AM
Updated 07/09/2023, 06:31 AM

Readers vividly remember how we released this market call last year: A China Stock Market Crash In 2017? Not Really!

In it, we explained in great detail why and how we strongly believed China’s stock market would be moving higher in 2017 and 2018, even if most were forecasting a bear market in Chinese stocks.

We recently followed up with this exceptional China stock market chart which confirms China is indeed going higher. Moreover, along the same lines, we wrote how China’s stock market is in a perfect but silent uptrend.

All our indicators are bullish.

To get an idea of how high China can go in the coming years, investors should check China’s long term stock market chart. Interestingly, we observe several interesting insights on that chart.

The 7 most appealing insights on China’s long term stock market chart

Below, the 25-year stock market chart of the Shanghai Exchange (SSEC), the leading stock market in China.

First, the stock market in China has been moving in a very long-term trend channel since early the 90s, as seen on the chart.

Second, the Shanghai Composite (SSEC) went through a very important bull market test last year, and successfully passed, see 2800 points. That was the ultimate confirmation that the bull market would continue.

Third, the bull market will remain silent as long as SSEC trades below the middle trend line within the channel. Once above it, the bull will become violent.

Fourth, China has a strong reputation of moving in a very aggressive way once a bull market starts heating up. Expect fireworks somewhere in the coming years, similar to 2015.

Fifth, the longer the silent uptrend, the higher the upside potential, as the channel is moving higher.

Sixth, the dotted lines on the chart show why 3500 points is, in a way, a breakout point; once above 3500 things are very bullish.

Last but not least, the risk/reward ratio is high at this point, given the position of the market (lower area with the trending channel).
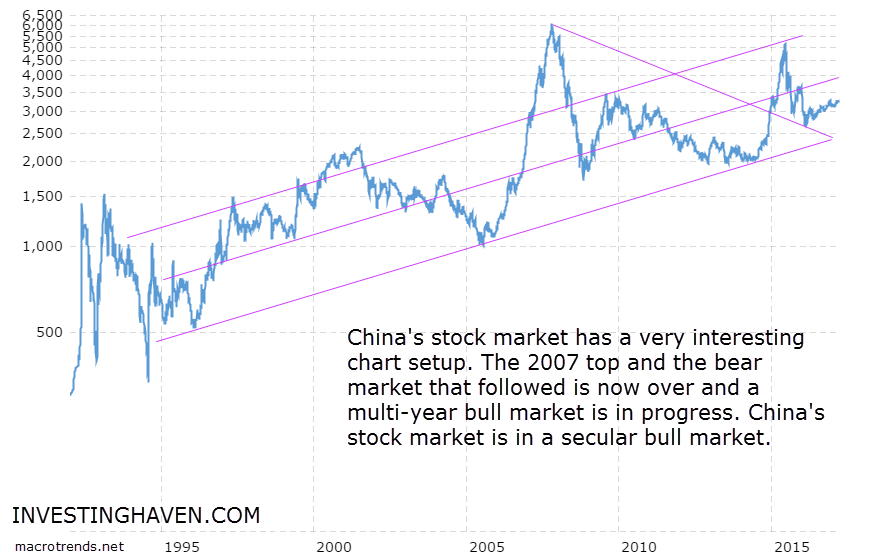
Shanghai Composite 1990-2020 (est.)

Original post

Latest comments

Risk Disclosure: Trading in financial instruments and/or cryptocurrencies involves high risks including the risk of losing some, or all, of your investment amount, and may not be suitable for all investors. Prices of cryptocurrencies are extremely volatile and may be affected by external factors such as financial, regulatory or political events. Trading on margin increases the financial risks.
Before deciding to trade in financial instrument or cryptocurrencies you should be fully informed of the risks and costs associated with trading the financial markets, carefully consider your investment objectives, level of experience, and risk appetite, and seek professional advice where needed.
Fusion Media would like to remind you that the data contained in this website is not necessarily real-time nor accurate. The data and prices on the website are not necessarily provided by any market or exchange, but may be provided by market makers, and so prices may not be accurate and may differ from the actual price at any given market, meaning prices are indicative and not appropriate for trading purposes. Fusion Media and any provider of the data contained in this website will not accept liability for any loss or damage as a result of your trading, or your reliance on the information contained within this website.
It is prohibited to use, store, reproduce, display, modify, transmit or distribute the data contained in this website without the explicit prior written permission of Fusion Media and/or the data provider. All intellectual property rights are reserved by the providers and/or the exchange providing the data contained in this website.
Fusion Media may be compensated by the advertisers that appear on the website, based on your interaction with the advertisements or advertisers.
© 2007-2024 - Fusion Media Limited. All Rights Reserved.