Tesla reports mixed Q2 results as softer demand dents sales

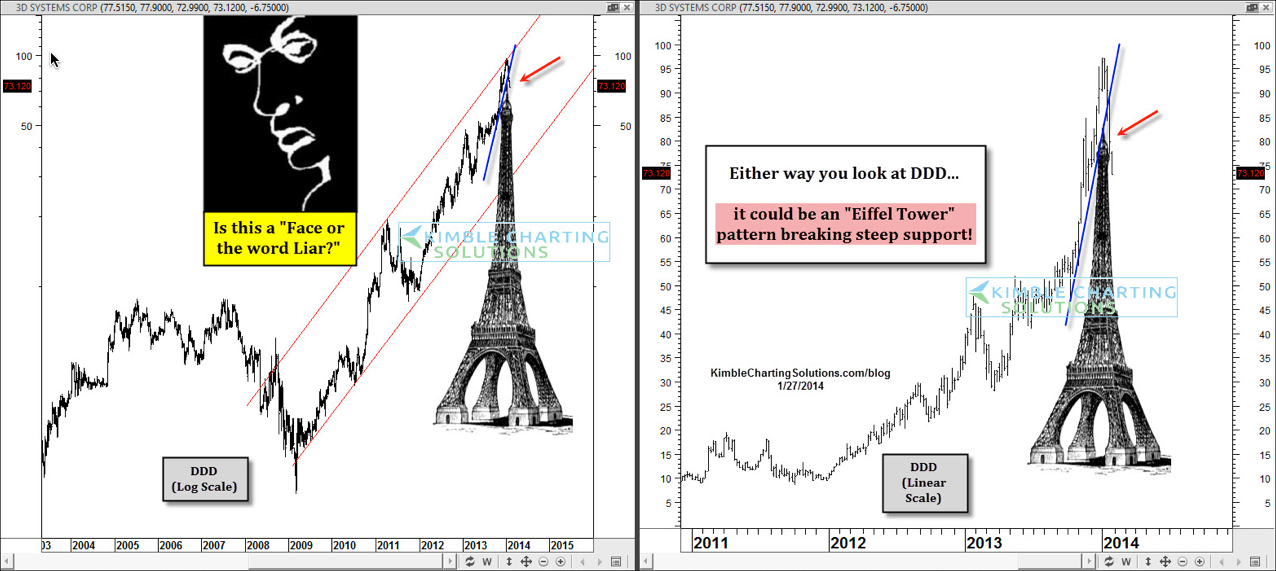
On 1/27 I shared the 2-pack above on Stocktwits.These charts represent the same stock using different scales: The log scale on the left and linear on the right. Regardless of which scale is used, a potential Eiffel Tower pattern looked to be in play and support was breaking in 3D systems (DDD).
With Eiffel tower patterns...if you experience the left side of the tower, you can experience the right side too. Eiffel tower patterns can get a little frustrating if this happens as support breaks on the right side of the Eiffel tower and you are long.
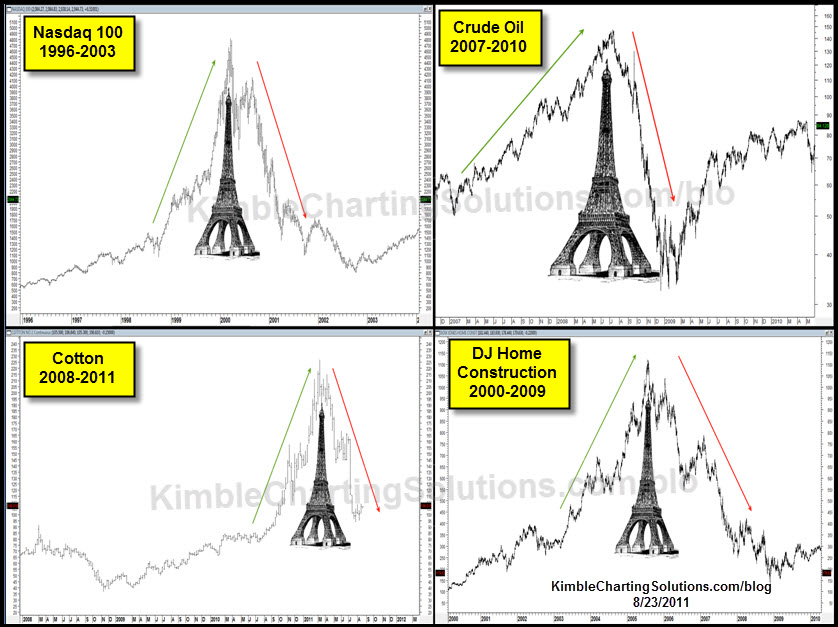
I shared the above 4-pack in August of 2011 when Gold looked to be making an Eiffel pattern at $1,900 per ounce. (see post here) , reflecting that Eiffel tower patterns in a variety of assets have taken place over the years as the right side ofteb declines to where the left side of the tower started. In other words, the majority of the gains ended up being wiped out.
3rd party Ad. Not an offer or recommendation by Investing.com. See disclosure here or remove ads.
Which stock should you buy in your very next trade?
With valuations skyrocketing in 2024, many investors are uneasy putting more money into stocks. Unsure where to invest next? Get access to our proven portfolios and discover high-potential opportunities.
In 2024 alone, ProPicks AI identified 2 stocks that surged over 150%, 4 additional stocks that leaped over 30%, and 3 more that climbed over 25%. That's an impressive track record.
With portfolios tailored for Dow stocks, S&P stocks, Tech stocks, and Mid Cap stocks, you can explore various wealth-building strategies.