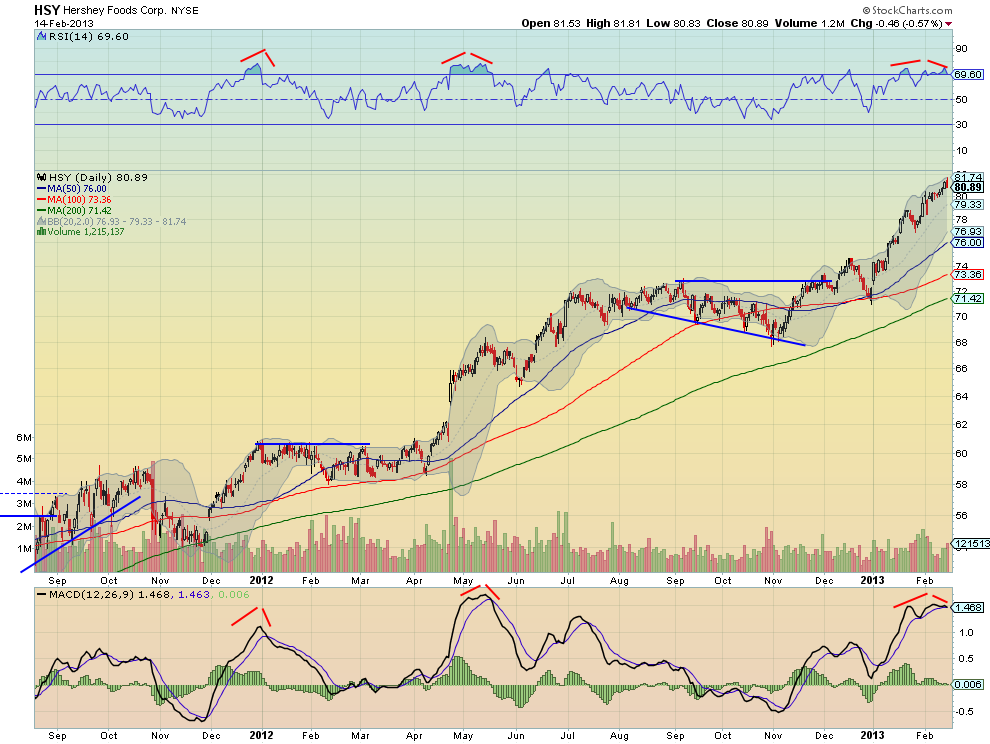
Hershey’s (HSY) has had a great run higher going back through early 2011. But after going steady with it for over two years it is time to dump it this Valentine’s Day. Let me explain why. The chart below gives 3 solid indications that a short term top is in. And past history shows that when that happens it just mopes around for 3 to 4 months. Who wants to be with a moping stock for 3 months. First look at the price action. It has moved up a perfect $10 since the last base, coinciding with the Measured Move and is extended from the 50 day Simple Moving Average (SMA). Next, the
Relative Strength Index (RSI) is peaking over 70, into overbought territory. Yes it can continue to become much more overbought but history (the red hats on chart) for Hershey’s is that this level is about it. Finally the Moving Average Convergence Divergence (MACD) signal line has hit an extreme, where the last consolidation occurred with the histogram about to move to negative. You may be able to get another dollar out of this stock but its rhythm, its history, suggests that it is time to play the field for a while. Enjoy your freedom. It is Valentine’s Day, maybe you will get lucky.
Disclosure: The information in this blog post represents my own opinions and does not contain a recommendation for any particular security or investment. I or my affiliates may hold positions or other interests in securities mentioned in the Blog, please see my Disclaimer page for my full disclaimer.
Original post
Which stock should you buy in your very next trade?
AI computing powers are changing the stock market. Investing.com's ProPicks AI includes 6 winning stock portfolios chosen by our advanced AI. In 2024 alone, ProPicks AI identified 2 stocks that surged over 150%, 4 additional stocks that leaped over 30%, and 3 more that climbed over 25%. Which stock will be the next to soar?
Unlock ProPicks AI