- German import prices data are expected to show inflation heating up
- US Pending Home Sales Index to rebound
- Oil bulls waiting (hoping) for Opec to extend deal on production cuts
Inflation in Europe will be topical today with the release of Germany’s import price data for February. Meanwhile, economists expect that the US Pending Home Sales Index will rebound after tumbling in January. In the oil market, all eyes continue to focus on Opec, which is considering an extension of its pact to cut production.
Germany: Import Price Index (0600 GMT): Inflation in the Eurozone jumped to a four-year high in February, rising above the European Central Bank’s (ECB) target rate. The acceleration in pricing pressure is largely due to higher energy prices, which suggests that the ECB won’t be pressured to raise interest rates. The outlook for monetary policy could change, however, if the incoming inflation data continues to run hot.
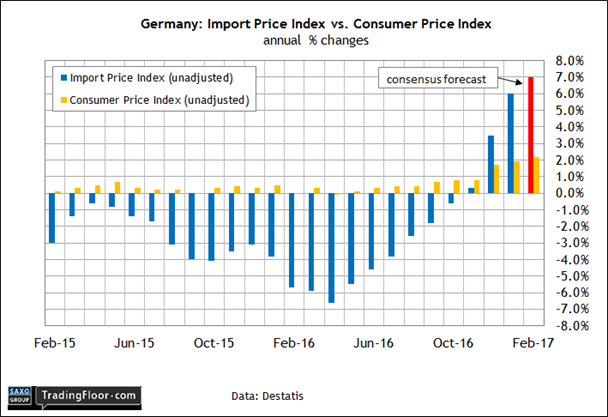
Today’s update on import prices for Germany offers an early clue on what to expect for consumer prices in March for the euro area. Recent history suggests that reflation will roll on.
Germany’s import price index has accelerated sharply in recent months, rising 6% in January compared with the year-earlier level, a six-year high. The trend is expected to edge even higher in February, advancing 7% in annual terms, according to TradingEconomics.com’s consensus forecast.
Inflation is a politically and economically sensitive subject in Germany. Not surprisingly, firmer pricing is inspiring new calls for monetary tightening. “It's high time for the ECB to move away from its ultra-loose monetary policy,” the Bavarian Finance Minister, Markus Soeder, said earlier this month.
Such sentiment is likely to strengthen if the crowd is right about today’s price data.

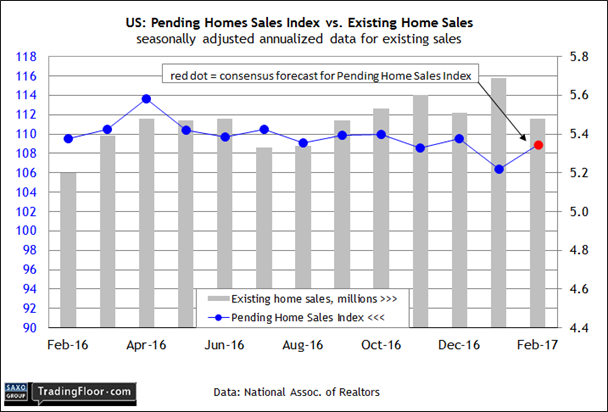
US: Pending Home Sales Index (1400 GMT): Sales of existing homes fell in February after reaching a 10-year high at the start of the year. The headwind isn’t linked to sagging demand; rather a shortage of houses for sale is the problem.
“Realtors are reporting stronger foot traffic from a year ago, but low supply in the affordable price range continues to be the pest that's pushing up price growth and pressuring the budgets of prospective buyers,” said the chief economist at the National Association of Realtors, the group that publishes the sales data. “Newly listed properties are being snatched up quickly so far this year and leaving behind minimal choices for buyers trying to reach the market.”
But the number of transactions may be poised to stabilise, based on expectations for today’s update of the Pending Home Sales Index (PHSI), which is considered a leading indicator of housing activity. Econoday.com’s consensus forecast sees PHSI rising 2.4% in February, the strongest monthly advance since last May and a solid reversal vs the loss in the previous month. Better, although the forecast still leaves the index near the lowest level in recent history.
What are the prospects for squeezing the supply glut? Higher than the hard data suggests. Builder confidence surged to a 12-year peak in March. “Builders are buoyed by President Trump’s actions on regulatory reform, particularly his recent executive order to rescind or revise the Waters of the US rule that impacts permitting,” noted the chairman of the National Association of Home Builders last week.

WTI Crude Oil: The oil bulls have taken a beating in March, but the question is whether OPEC will soon ride to the rescue?
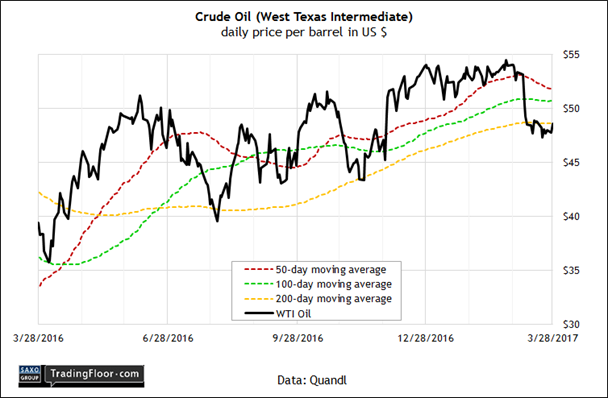
Last year the cartel engineered an agreement to cut oil production, which laid the foundation for a rally that lifted the price of West Texas to $54 a barrel as of late last month. But news of excess supply since then has weighed on the market, pushing prices down to the $48-$49 range.
But a fresh round of intervention is reviving animal spirits, albeit on the margins, in the wake of Sunday’s news that OPEC is considering a plan to extend its agreement to curtail supplies by six months. But the rally so far is weak. WTI in midday trading on Tuesday was roughly $48.50.
Analysts say that OPEC's announcement to review the possibility of a cut, as opposed to announcing one, isn’t an encouraging sign for the bulls. “The dropping of the recommendation to extend cuts in favor of technical review committee is likely to lead to a lot of disappointment and potential further liquidation of long positions by money managers that will put downward pressure on oil prices,” advised the head of commodities strategy at BNP Paribas in London.
The technical profile of WTI also paints a cautious outlook for expecting higher prices. Although oil has stabilised at just above the $48 level, the spot price has recently fallen to its 200-day moving average for the first time this year. The dip suggests that the bulls will have a tough time without a new OPEC announcement of a production cut.

Disclosure: Originally published at Saxo Bank TradingFloor.com
