Morgan Stanley identifies next wave of AI-linked "alpha"
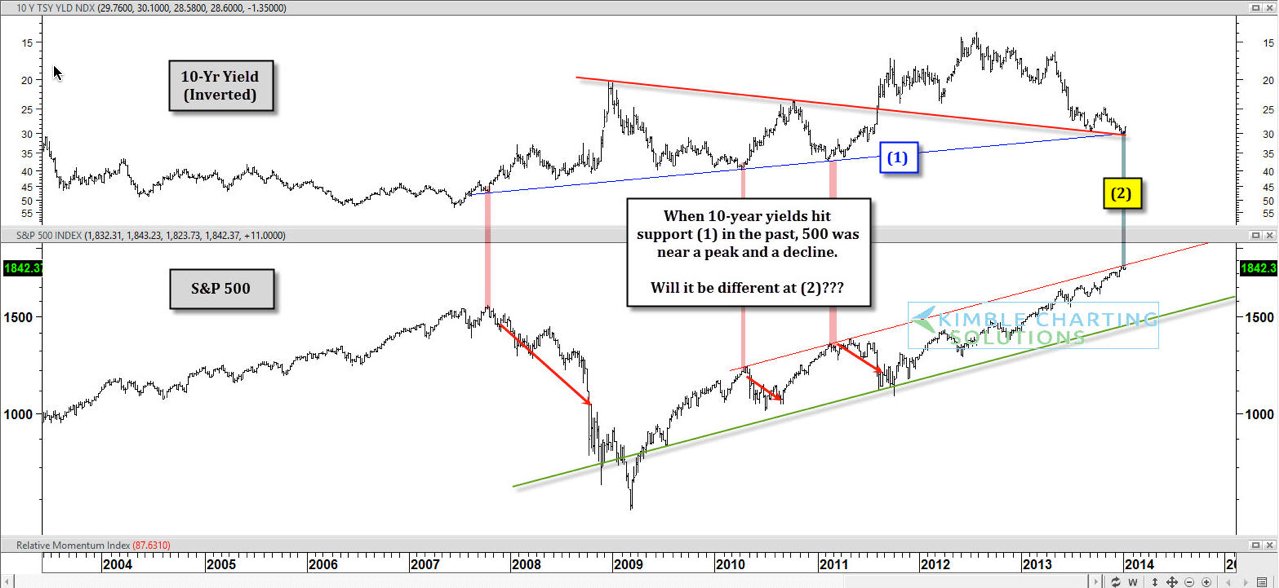
What do the three largest declines in the S&P 500 since 2007 have in common? It has nothing to do with a low VIX! Nor does it have to do with extreme bullish sentiment.
Any thoughts what might tie these declines together?
The top chart is the yield on the 10-year note (inverted). By inverting the series, you get a sense of what Bonds looked like over the past 10-years. This chart reflects that the inverted yield is on support line (1). Each of the three different times the yield has hit support line (1), the S&P 500 has declined: Two 15% declines (2010 and 2011) and a much larger decline in 2007.

At (2) in the chart above, yields are back at this key line. So what happens next?
We're now facing a situation that hasn't happened in three years -- one that has led to large moves in the bond market/interest rate complex.
Which stock should you buy in your very next trade?
AI computing powers are changing the stock market. Investing.com's ProPicks AI includes 6 winning stock portfolios chosen by our advanced AI. In 2024 alone, ProPicks AI identified 2 stocks that surged over 150%, 4 additional stocks that leaped over 30%, and 3 more that climbed over 25%. Which stock will be the next to soar?
Unlock ProPicks AI
