As I write these words, the news out of Washington, DC is that a fiscal cliff deal has reached an impasse in the Senate. Nevertheless, I was surprised to see ES futures up modestly.
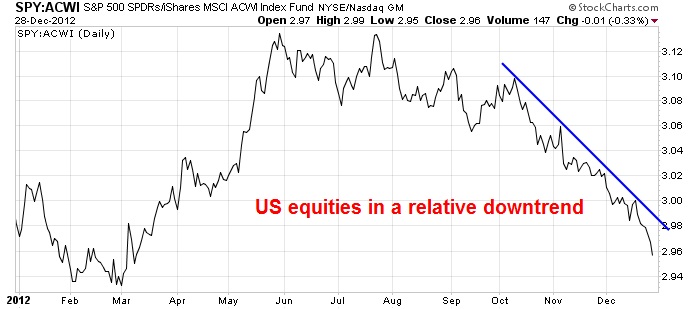
Regardless of the outcome of the fiscal cliff negotiations, a review of global equity markets indicates that the leadership is outside the US and a fiscal cliff relief rally (when it comes) would be a good opportunity for American investors to diversify their holdings outside the country. Consider this chart showing the relative returns of US stocks compared to MSCI All-Country World (ACWI).
US equities peaked out on a relative basis in July and have been underperforming global equities ever since: 
Despite the sunnier outlook shown by the American economy relative to many parts of the world, this analysis shows that the outlook for US equities may not be so bright in 2013.
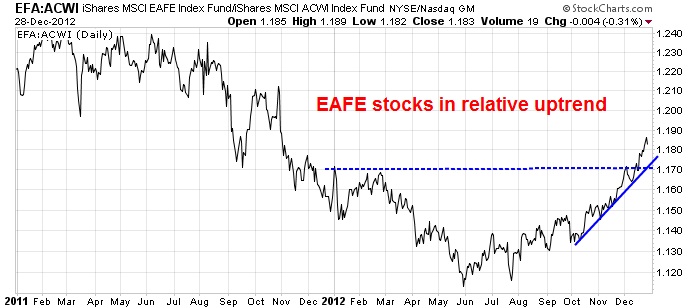
When we analyze the weightings in ACWI, the main components by weight are US stocks, developed market stocks (EAFE) and the emerging market stocks. EAFE is composed mainly of Japan and Europe, with a minor weight in the Asia Ex-Japan region. Any way you look at it, developed market stocks, as represented by EAFE, are showing relative leadership. They bottomed on a relative basis in August and have been roaring ahead ever since. In December, these stocks staged a relative breakout indicating sustainable strength.
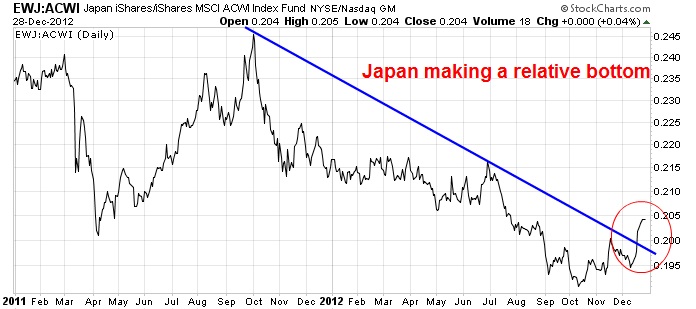
Much of the relative strength in EAFE comes from Europe, which I have written extensively about before (see Europe poised for a renaissance). The other major component of EAFE is Japan and Japanese equities which have recently staged a turnaround. The chart below of Japan against ACWI shows that Japanese stocks have rallied through a relative downtrend that began in October 2011.
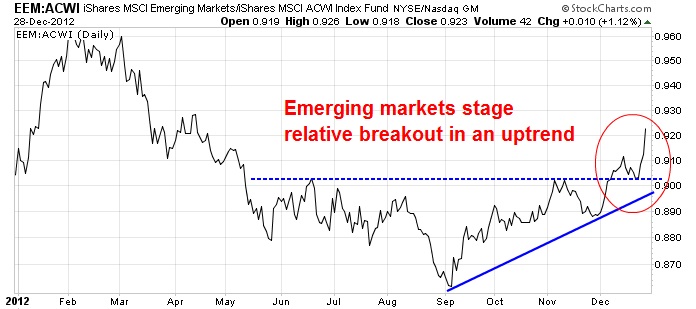
The last major component of ACWI are emerging market stocks. These stocks bottomed on a relative basis in early September and they have been outperforming ever since. Technicians can be encouraged by the fact that EEM staged a relative upside breakout against ACWI in early December and they have been on a tear ever since. Much of that strength can be attributed to the perceived soft landing in China.
In conclusion, these relative return charts show that US equities have been trailing global stocks since the summer of 2012. Regardless of how the fiscal cliff resolves itself, this analysis suggest that equity investors are better served by a larger weighting outside the US.
My personal favorites are Europe and the emerging markets (in that order), but the bottom line is: avoid US stocks for the time being.
Disclosure: Long FEZ.
Cam Hui is a portfolio manager at Qwest Investment Fund Management Ltd. ("Qwest"). This article is prepared by Mr. Hui as an outside business activity. As such, Qwest does not review or approve materials presented herein. The opinions and any recommendations expressed in this blog are those of the author and do not reflect the opinions or recommendations of Qwest.
None of the information or opinions expressed in this blog constitutes a solicitation for the purchase or sale of any security or other instrument. Nothing in this article constitutes investment advice and any recommendations that may be contained herein have not been based upon a consideration of the investment objectives, financial situation or particular needs of any specific recipient. Any purchase or sale activity in any securities or other instrument should be based upon your own analysis and conclusions. Past performance is not indicative of future results. Either Qwest or Mr. Hui may hold or control long or short positions in the securities or instruments mentioned.
Which stock should you buy in your very next trade?
With valuations skyrocketing in 2024, many investors are uneasy putting more money into stocks. Unsure where to invest next? Get access to our proven portfolios and discover high-potential opportunities.
In 2024 alone, ProPicks AI identified 2 stocks that surged over 150%, 4 additional stocks that leaped over 30%, and 3 more that climbed over 25%. That's an impressive track record.
With portfolios tailored for Dow stocks, S&P stocks, Tech stocks, and Mid Cap stocks, you can explore various wealth-building strategies.

