I like price formations, especially rectangle. They are quick to assess, easy to understand and most importantly one cannot miss it even if they are seen without support and resistance lines. So easy it is. And above all, once they break out either way, chances are high that they follow the same direction. It would be interesting to see how these stocks behave in coming days and weeks trading.
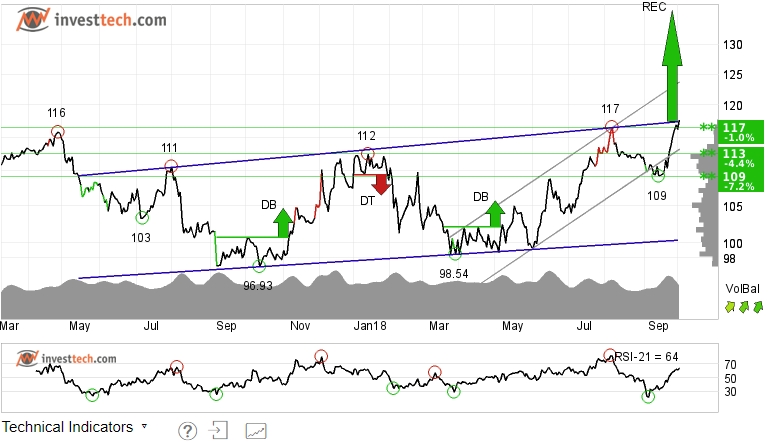
Walt Disney Company (NYSE:DIS) Close: 117.66
Investors over time have bought Walt Disney shares steadily at higher prices and the stock is in a rising trend channel in the medium term chart. The stock on Tuesday closed at its highest level, just breaking out from the ceiling of the rectangle since the begynning of 2016. This signals increasing optimism among investors and indicates continued rise in price.
The price formation gives a target of 134-135 dollars and in case of a reaction back there is support between 113-109 dollars. This give a favourable risk-reward ratio.
To add to this interesting case, the volume balance indicator has been very positive and momentum in the stock is rising. Hence the stock is overall assessed as technically positive for the medium to long term.
Investtech's outlook (one to six weeks): Positive
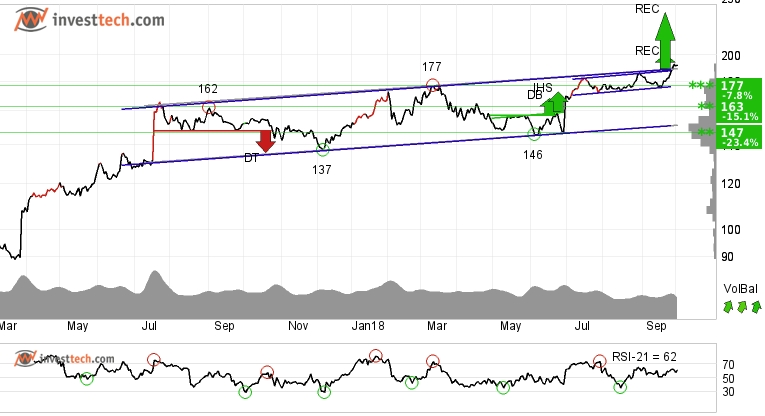
Vertex Pharmaceuticals (NASDAQ:VRTX) Close: 191.93
After being inside an almost horizontal trend for over an year, Vertex Pharmaceutica has given a breakout from two rectangle formations at the same time. The formation gives a price target of a little under 230 dollars. In case of a reaction downwards, there is support around 177.
Positive volume balance shows that volume is higher on days with rising prices than days with falling prices. This indicates increasing optimism among investors. The RSI curve shows a rising trend, which could be an early signal for the start of a rising trend for the price as well.
Investtech's outlook (one to six weeks): Positive
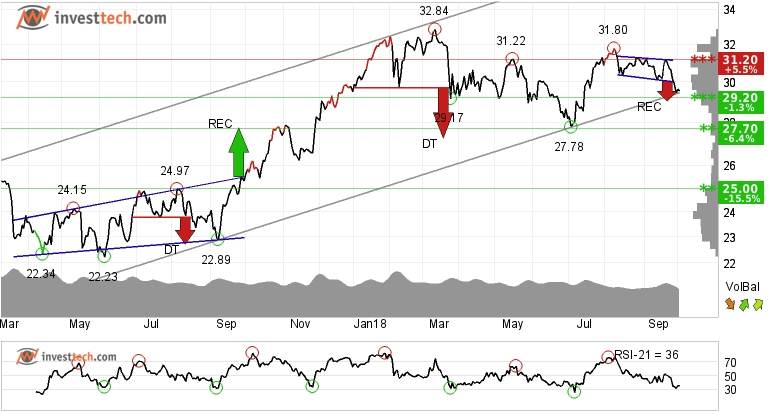
Bank of America Corp (NYSE:BAC) Close: 29.58
Bank of America Corp is in a rising trend channel in both the medium and long term chart. Interesting to see that the stock has broken down from a rectangle formation and closed very close to the uptrend line in Tuesday's trade. Also it is testing its earlier support level around 29.20. A break and close below this level can initiate fresh selling in Bank Of America stocks and it can tumble down to 27.70 dollars or lower.
Volume has previously been low at price tops and high at price bottoms. This weakens the rising trend and could be an early signal for a coming trend break. So keep an eye on this stock.
There is resistance around 30.13 and 30.40.
Investtech's outlook (one to six weeks): Watch
Investtech has done extensive research on this formation in the Scandinavian markets for a given time period. They came out with some impressive numbers that show the Rectangle formation has produced better return than the main index. More can be read about this research and its results.
Written by,
Kiran Shroff, CMT
Technical Analyst, www.investtech.com
Which stock should you buy in your very next trade?
AI computing powers are changing the stock market. Investing.com's ProPicks AI includes 6 winning stock portfolios chosen by our advanced AI. In 2024 alone, ProPicks AI identified 2 stocks that surged over 150%, 4 additional stocks that leaped over 30%, and 3 more that climbed over 25%. Which stock will be the next to soar?
Unlock ProPicks AI


