T2108 Status: 34.9%
VIX Status: 20.1
General (Short-term) Trading Call: Hold with bearish hedges
Commentary:
The churn continues as my “firm bullishness” from two days ago quickly turns into increased caution. This period was so brief, I barely had a chance to expand my short-term bullish positions -- I added a handful of JKS shares to my SSO shares and Siemens call options -- and I instead find myself with more bearish ones, mainly in the form of more VXX call options and shares.
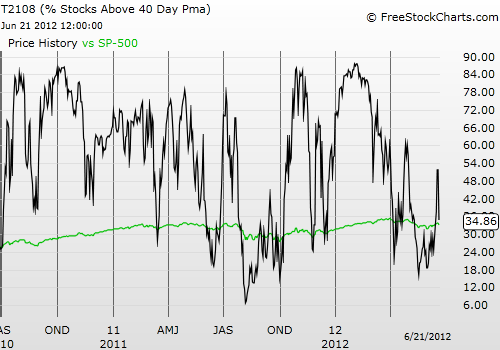
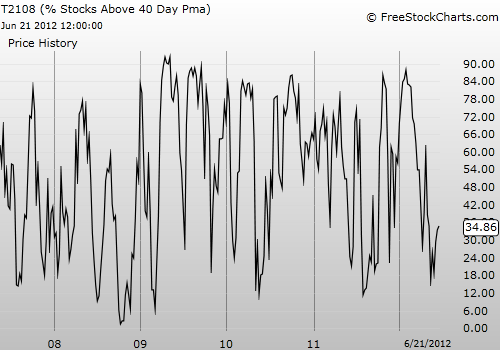
T2108 was crushed on Thursday, dropping from 52% to 35% (directly above the 50DMA for T2108). The S&P 500 dropped 2.2%, placing it below its 50DMA again and erasing my earlier bullishness. Note well that this sharp drop is what I would normally expect for the index to work off extremely overbought stochastics. If the index remains healthy, it will bounce back quickly. I am not optimistic in the short-term given the drop below the important support now turned resistance again at the 50-DMA.
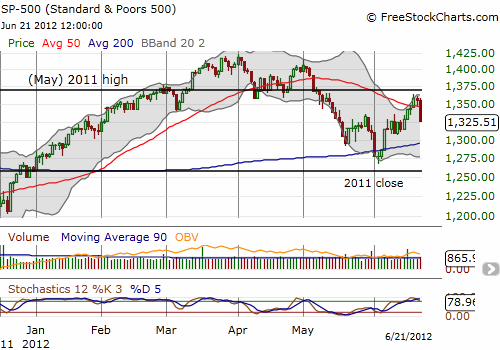
Note how the S&P 500 also fell below the previous resistance formed by the highs following May’s oversold period. The index will need to re-fight its way if it bounces from here. Ultimately, we should watch to see whether a trading range sustains itself between the 2011 high (in May) and the 2011 close.
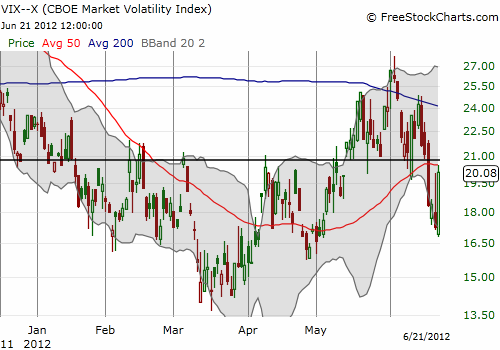
As I expected, volatility was crushed after the Fed announcement, but on Thursday it soared as if it was responding to pent-up demand. The VIX is now again knocking on the door of the critical 21 level.
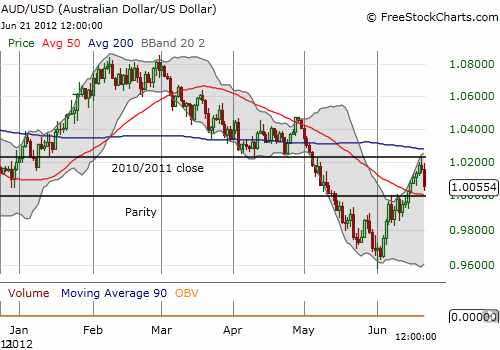
This all adds up to a likely increase in risk aversion. The Australian dollar further confirms the flee from risk. The currency plunged against the U.S. dollar and almost dropped back to parity after a very strong run. It maintained perfect resistance at the 2010/2011 close.
At this point, a lot of caution is warranted. The S&P 500 has to climb above 50-DMA resistance yet again for me to throw some caution to the wind. Even then, the additional resistance of the May highs from 2011 and 2012 await. Otherwise, I wait for another oversold reading.
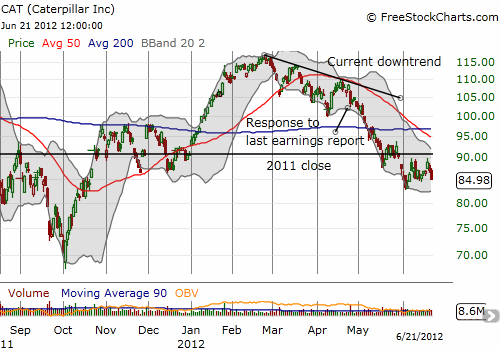
Finally, note that the cyclical indicator in Caterpillar (CAT) continues to flash red. The stock never benefited much from the previous rally, it remains negative for the year, and it has been unable to challenge that resistance since late May. CAT also had another sales report and analyst presentation this week that failed to impress the market.
Daily T2108 vs the S&P 500
Be careful out there!
Full disclosure: long SDS, SSO; long VXX calls, puts, and shares; long SI calls; long CAT, long JKS
VIX Status: 20.1
General (Short-term) Trading Call: Hold with bearish hedges
Commentary:
The churn continues as my “firm bullishness” from two days ago quickly turns into increased caution. This period was so brief, I barely had a chance to expand my short-term bullish positions -- I added a handful of JKS shares to my SSO shares and Siemens call options -- and I instead find myself with more bearish ones, mainly in the form of more VXX call options and shares.
T2108 was crushed on Thursday, dropping from 52% to 35% (directly above the 50DMA for T2108). The S&P 500 dropped 2.2%, placing it below its 50DMA again and erasing my earlier bullishness. Note well that this sharp drop is what I would normally expect for the index to work off extremely overbought stochastics. If the index remains healthy, it will bounce back quickly. I am not optimistic in the short-term given the drop below the important support now turned resistance again at the 50-DMA.

Note how the S&P 500 also fell below the previous resistance formed by the highs following May’s oversold period. The index will need to re-fight its way if it bounces from here. Ultimately, we should watch to see whether a trading range sustains itself between the 2011 high (in May) and the 2011 close.
As I expected, volatility was crushed after the Fed announcement, but on Thursday it soared as if it was responding to pent-up demand. The VIX is now again knocking on the door of the critical 21 level.
3rd party Ad. Not an offer or recommendation by Investing.com. See disclosure here or remove ads.

This all adds up to a likely increase in risk aversion. The Australian dollar further confirms the flee from risk. The currency plunged against the U.S. dollar and almost dropped back to parity after a very strong run. It maintained perfect resistance at the 2010/2011 close.

At this point, a lot of caution is warranted. The S&P 500 has to climb above 50-DMA resistance yet again for me to throw some caution to the wind. Even then, the additional resistance of the May highs from 2011 and 2012 await. Otherwise, I wait for another oversold reading.
Finally, note that the cyclical indicator in Caterpillar (CAT) continues to flash red. The stock never benefited much from the previous rally, it remains negative for the year, and it has been unable to challenge that resistance since late May. CAT also had another sales report and analyst presentation this week that failed to impress the market.

Daily T2108 vs the S&P 500


Be careful out there!
Full disclosure: long SDS, SSO; long VXX calls, puts, and shares; long SI calls; long CAT, long JKS
Which stock should you buy in your very next trade?
With valuations skyrocketing in 2024, many investors are uneasy putting more money into stocks. Unsure where to invest next? Get access to our proven portfolios and discover high-potential opportunities.
In 2024 alone, ProPicks AI identified 2 stocks that surged over 150%, 4 additional stocks that leaped over 30%, and 3 more that climbed over 25%. That's an impressive track record.
With portfolios tailored for Dow stocks, S&P stocks, Tech stocks, and Mid Cap stocks, you can explore various wealth-building strategies.
