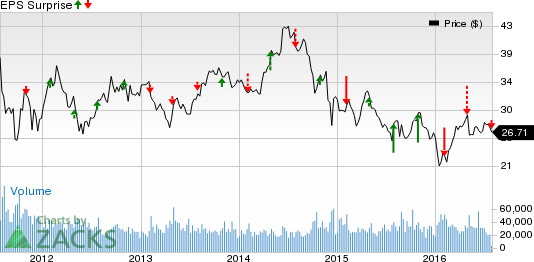
Suncor Energy Inc. (NYSE:SU) reported second-quarter 2016 operating loss per share of 28 U.S cents, wider than the Zacks Consensus Estimate of loss of 25 U.S. cents. The company had posted a profit of 51 U.S. cents per share in the year-ago comparable quarter. Shut down of production at Oil Sands operations and Syncrude following wildfire in the Fort McMurray region led to the underperformance. Lower refinery utilization also added to the woes.
Moreover, quarterly revenues of U.S$4.5 billion decreased significantly from U.S$6.6 billion in the year-ago quarter. However, the top-line surpassed the Zacks Consensus Estimate of U.S$4.2 billion.
Suncor incurred quarterly operating loss of C$565 million. The company had earned C$906 million in the year-ago quarter. Moreover, cash flow from operations decreased to C$916 million from C$2.2 billion in the second quarter of 2015.
Production
Total upstream production in the reported quarter averaged 330,700 barrels of oil equivalent per day (BOE/d), down 40.9% from the prior-year level of 559,900 BOE/d. This was primarily the result of shut down of production at Oil Sands operations and Syncrude as a result of the wildfire in the Fort McMurray region.
Oil Sands operations volume was 177,500 barrels per day (Bbl/d), lower than 423,800 Bbl/d in the year-ago quarter.
Production from Syncrude operations was 35,600 Bbl/d in the quarter, significantly higher than 24,900 Bbl/d in the year-ago quarter.
Suncor’s Exploration and Production segment (consisting of International and Offshore and Natural Gas segments) produced 117,600 BOE/d. The segment had produced 111,200 BOE/d in the prior-year quarter.
The Refining and Marketing segment produced 400,200 Bbl/d of refinery crude processed, down from 416,800 Bbl/d in the year-ago quarter. Refinery utilization came in at 87% as against the year-ago quarter level of 90%.
Product Sales
The company’s refined product sales of 532,500 Bbl/d decreased from the prior-year quarter level of 525,500 Bbl/d.
Balance Sheet & Capital Expenditure
As of Jun 30, 2016, Suncor had cash and cash equivalents of C$3 billion and total long-term debt (including current portions) of C$14.9 billion. The total debt-to-capitalization ratio was approximately 25.1%. Moreover, the company incurred capital expenditure of C$1.8 billion in the quarter.
Guidance
Suncor maintained its 2016 capital spending projection at C$6.0–C$6.5 billion.
The company increased its projected full-year total production to 585,000–620,000 BOE/d from the prior projection of 525,000–565,000 BOE/d. Suncor projected 2016 Oil Sands sales is in the band of 365,000–395,000 Bbl/d.
Refinery throughput was reiterated in the range of 420,000–440,000 Bbl/d. Refined products sales are anticipated in the 510,000–550,000 Bbl/d band.
Zacks Rank
Suncor currently carries a Zacks Rank #2 (Buy), implying that it will outperform the broader U.S. equity market over the next one to three months.
Investors can also consider players in the energy sector like Vanguard Natural Resources, LLC (NASDAQ:VNR) , QEP Resources, Inc. (NYSE:QEP) and McDermott International Inc. (NYSE:MDR) . All these stocks sport a Zacks Rank #1 (Strong Buy).
MCDERMOTT INTL (MDR): Free Stock Analysis Report
SUNCOR ENERGY (SU): Free Stock Analysis Report
QEP RESOURCES (QEP): Free Stock Analysis Report
VANGUARD NATURL (VNR): Free Stock Analysis Report
Original post

