It finally happened. For the first time since 2008, the Organization of Petroleum Exporting Countries (OPEC) agreed to a crude oil production cut last week, renewing hope among producers and investors that prices can begin to recover in earnest after a protracted two-year slump, one of the worst in living memory.
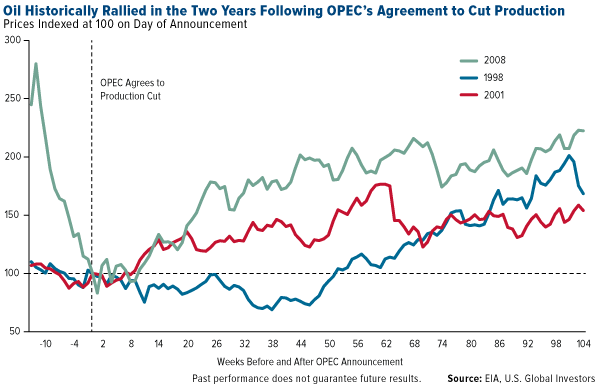
The last three times the cartel agreed to trim output—in 2008, 2001 and 1998—oil rallied in the following weeks and months. Of course, there’s no guarantee the same will happen this time around, as other market forces are at play, but it’s helpful to look at the historical precedent.
OPEC’s decision follows a strong endorsement from Goldman Sachs, which upgraded its rating on basic materials to overweight for the first time in four years. Analysts see commodities gaining 9 percent on average over the next three months, 11 percent over the next six months.
As reported by TheStreet’s Paul Whitfield, Goldman’s change of heart was prompted by “the recent acceleration in global PMIs (purchasing managers’ indexes),” which “suggests commodity markets are entering a cyclically stronger environment.”
The JPMorgan Global Manufacturing PMI rose slightly in November to a 27-month high of 52.1, extending sector expansion for the sixth straight month—very encouraging news.
As I’ve shared with you many times before, our own research has shown a strong correlation between PMI performance and commodity prices three and six months out. I’m thrilled to see Wall Street and media outlets coming around to this realization as well.
In short, OPEC’s production cut is constructive for energy in the near term, while a rising PMI is good news for the long term.
$70 Oil Next Year?
Since oil collapsed in September 2014, as much as $4 billion have been wiped from oil workers’ wages in the U.S. alone, according to Bureau of Labor Statistics data. Countries that rely heavily on oil revenue—Venezuela, Colombia, Russia and Nigeria, notably—have had to stretch balance sheets. And for the first time in nearly 40 years, Alaska, where the oil industry accounts for half of all economic activity, is scheduled to impose an income tax by 2019.
Many analysts now find reason to be optimistic about a recovery in energy. Speaking to the Houston Chronicle, David Pursell of energy investment bank Tudor, Pickering, Holt & Co. predicts “2017 will be a better year for oil and gas activity than we anticipated.” Pursell sees crude possibly rallying above $70 a barrel sometime next year.
The OPEC deal, announced last Wednesday, aims to reduce production by 1.2 million barrels a day, or about 1 percent of global output. For comparison’s sake, the cartel, which controls a third of all oil production, agreed to a reduction of 2.2 million barrels a day in 2008. Although not an OPEC member, Russia has also agreed to trim production—by about 300,000 barrels a day—the first time it’s cooperated with OPEC since 2001.
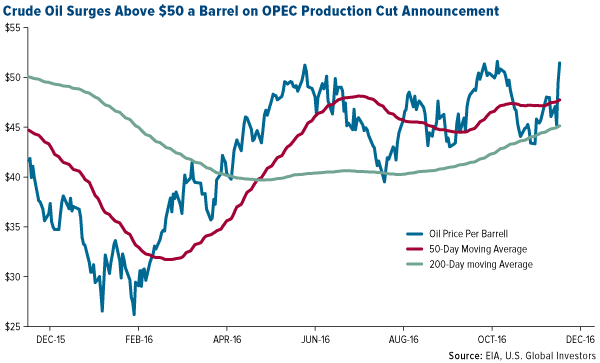
Following the announcement, West Texas Intermediate (WTI) crude surged above $50 a barrel.
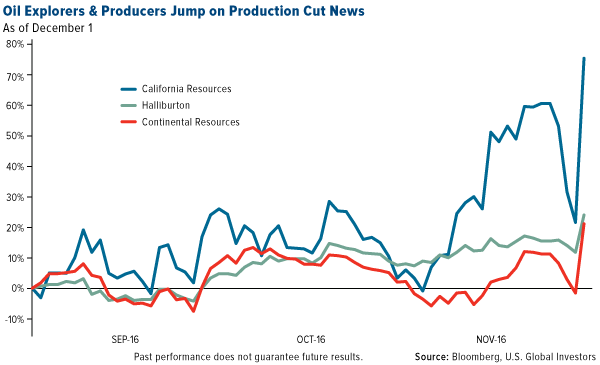
Meanwhile, investors piled into oil ETFs, with inflows into one surpassing $1 billion on Thursday alone. Shares of Halliburton (NYSE:HAL), Continental Resources (NYSE:CLR) and California Resources (NYSE:CRC) all saw dramatic spikes.
The Challenges Ahead
Some investors are understandably cautious. OPEC doesn’t have the authority to enforce compliance from its 14 member-nations, and output has typically exceeded quotas.
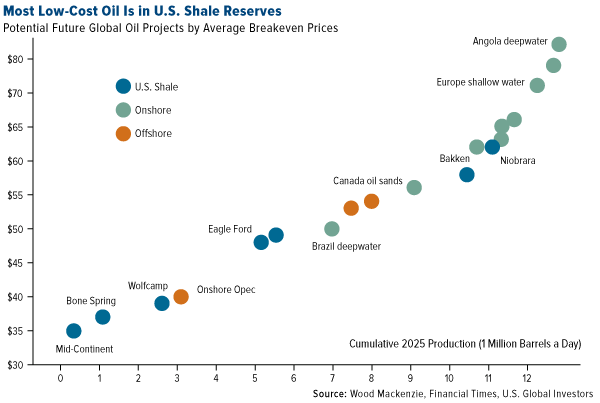
What’s more, it’s likely U.S. shale producers, which today operate at lower costs compared to other players, will be first to take advantage of a bump in prices. Drilling activity is already accelerating. Since May, the number of active oil rigs in North America has climbed 50 percent to 474, as of November 23.
“U.S. oil production growth is all but guaranteed to return in 2017,” according to Joseph Triepke, founder of oil research firm Infill Thinking. Triepke adds that as many as 150 rigs could be reactivated next year in Texas’ Permian Basin alone.
It’s there, in the Wolfcamp formation of the Permian, that the United States Geological Survey (USGS) recently discovered 20 billion barrels of “technically recoverable” oil, the largest deposit ever to be found in the U.S. Bloomberg reports that the deposit is worth an estimated $900 billion at today’s prices.
On the demand side, higher prices could spell trouble in emerging countries whose currencies have weakened against the U.S. dollar in recent months, especially since Donald Trump won the presidential election. Because oil is priced in dollars, it’s become more expensive in China and India, the second and third largest oil consumers following the U.S.
Gold Looks Technically Oversold, Ready for a Price Reversal
As I often say, every asset class has its own DNA of volatility, which is measured by standard deviation. Specifically, standard deviation gauges the typical fluctuation of a security or asset class around its mean return over a period of time ranging from one day to 12 months or more.
This brings us to mean reversion, which is the theory that, although prices might trend up for some time (as in a bull market), or fall (as in a bear market), they tend to move back toward their historic averages eventually.
Such elasticity is the basis for knowing when an asset is overbought or oversold—and when to sell or buy.
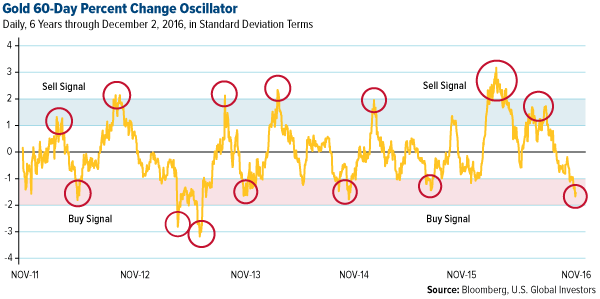
As you can see in the oscillator below, gold looks oversold right now and is nearing a “buy” signal, after which we can statistically expect it to return to its mean.
Gold’s current standard deviation for the 60-day period is about 7 percent—you can reasonably expect it to move this much over a two-month period, therefore, 68 percent of the time.
For more on standard deviation and mean reversion, you can download my whitepaper on the subject, here.
Disclosure: All opinions expressed and data provided are subject to change without notice. Some of these opinions may not be appropriate to every investor. By clicking the link(s) above, you will be directed to a third-party website(s). U.S. Global Investors does not endorse all information supplied by this/these website(s) and is not responsible for its/their content. This commentary should not be considered a solicitation or offering of any investment product. Certain materials in this commentary may contain dated information. The information provided was current at the time of publication.

